Suicide Deaths in the United States
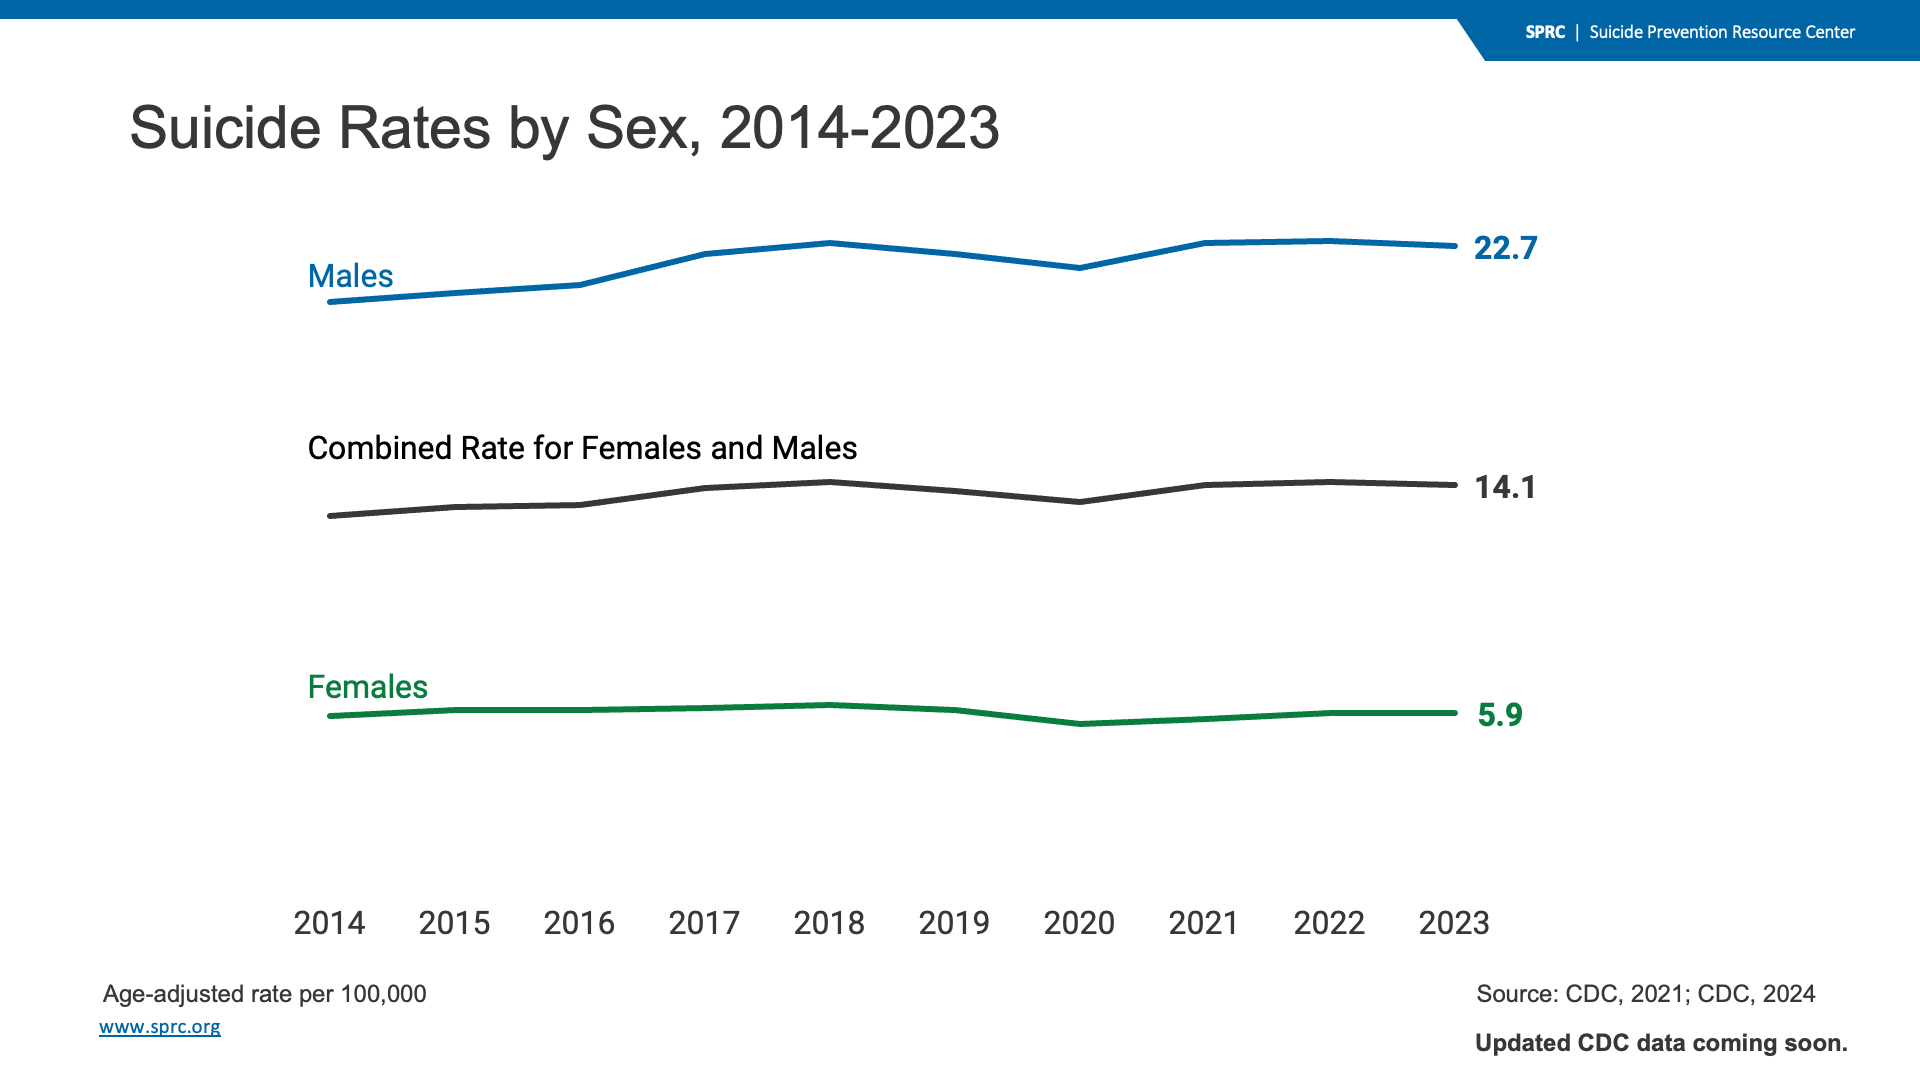
Suicide death rates increased among both males and females in the U.S. from 2014 to 2023.
From 2014 to 2023, the total age-adjusted suicide death rate increased from 13 to 14.1 per 100,000. Between 2014 and 2023, the rate increased from 20.7 to 22.7 for males. The rate for males was constant from 2021 to 2023. The age-adjusted suicide death rate for females increased from 5.8 in 2014 to a high of 6.2 in 2018 and returned to 5.9 in 2022 and 2023. For each group, rates between 2021 and 2023 remained flat, within one-tenth of a point for each year.
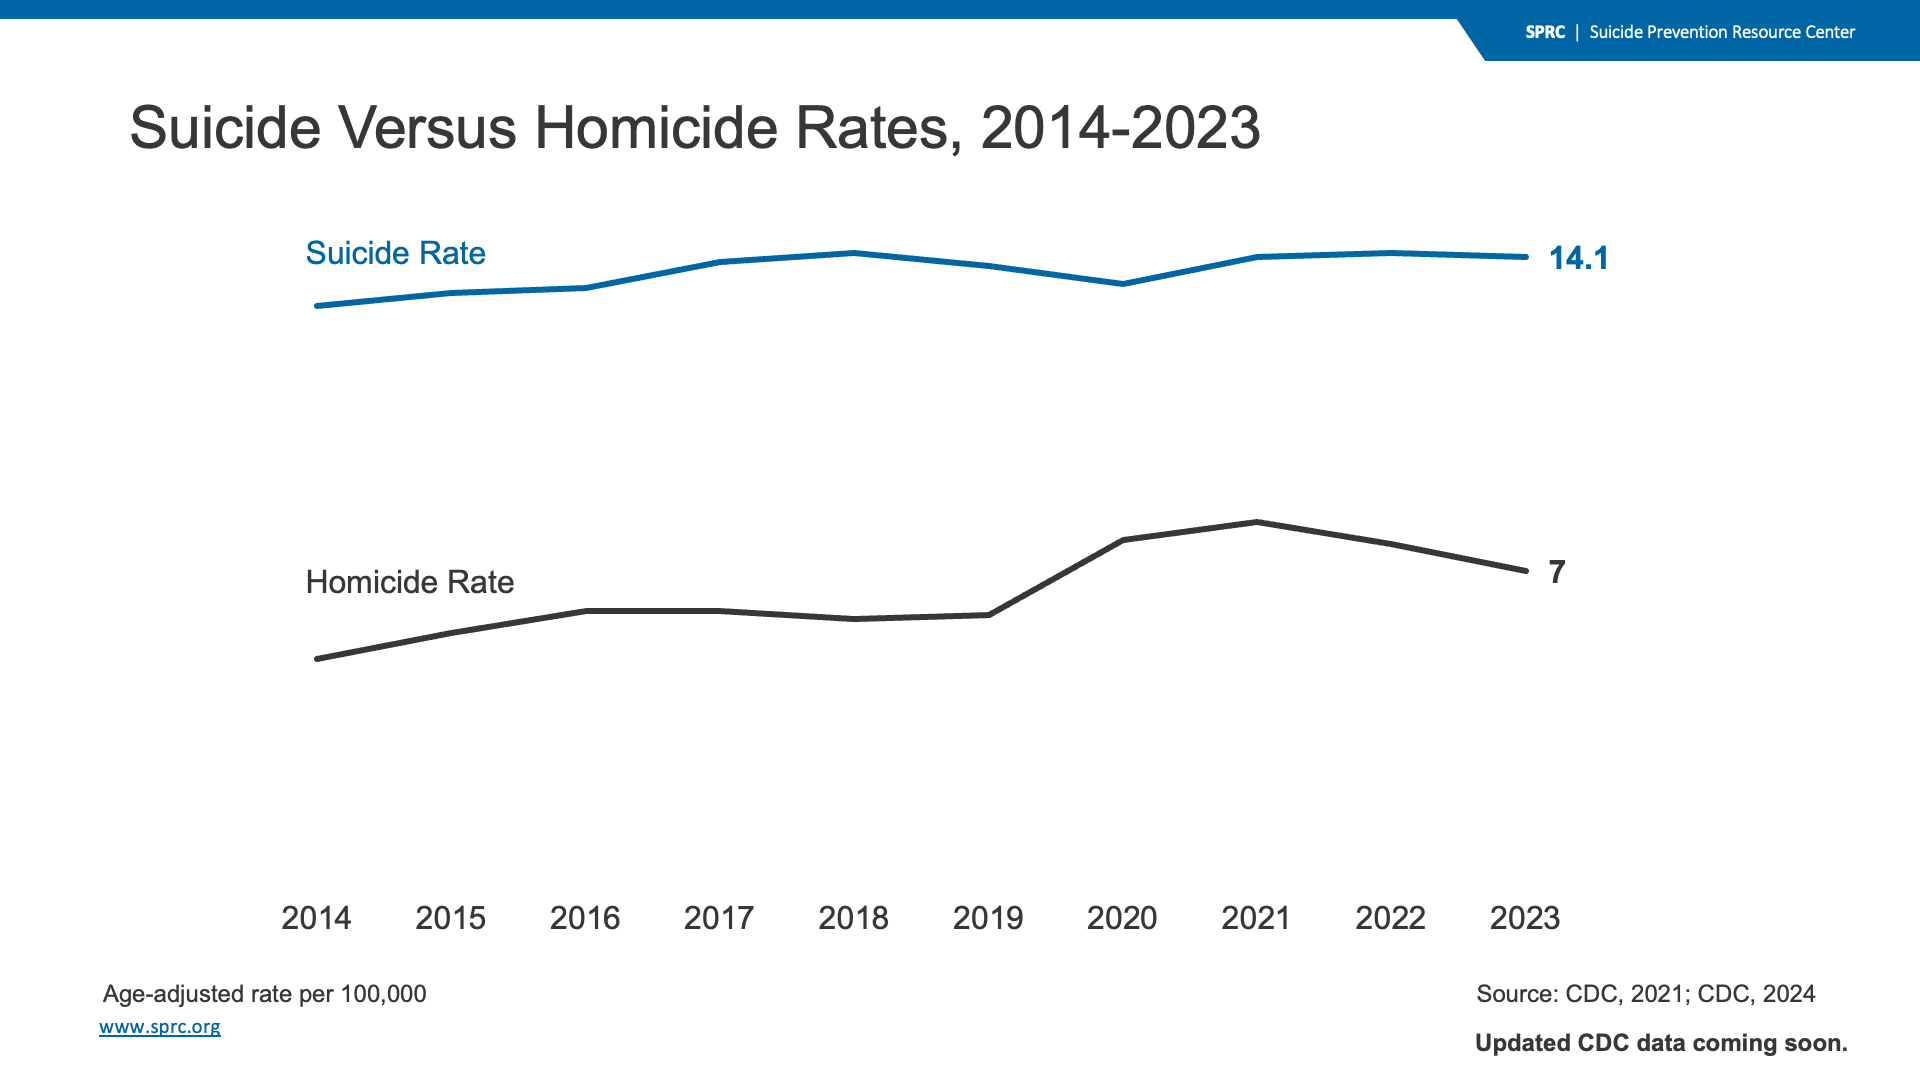
Suicide deaths consistently outnumber homicide deaths in the U.S., and this was the case from 2014 to 2023.
The homicide rate has grown disproportionately to the suicide rate. The suicide rate increased from 13 per 100,000 in 2014 to 14.1 in 2023. At the same time, the homicide rate increased from 5 in 2014 to a high of 8.1 in 2021 and decreased to 7 per 100,000 in 2023.
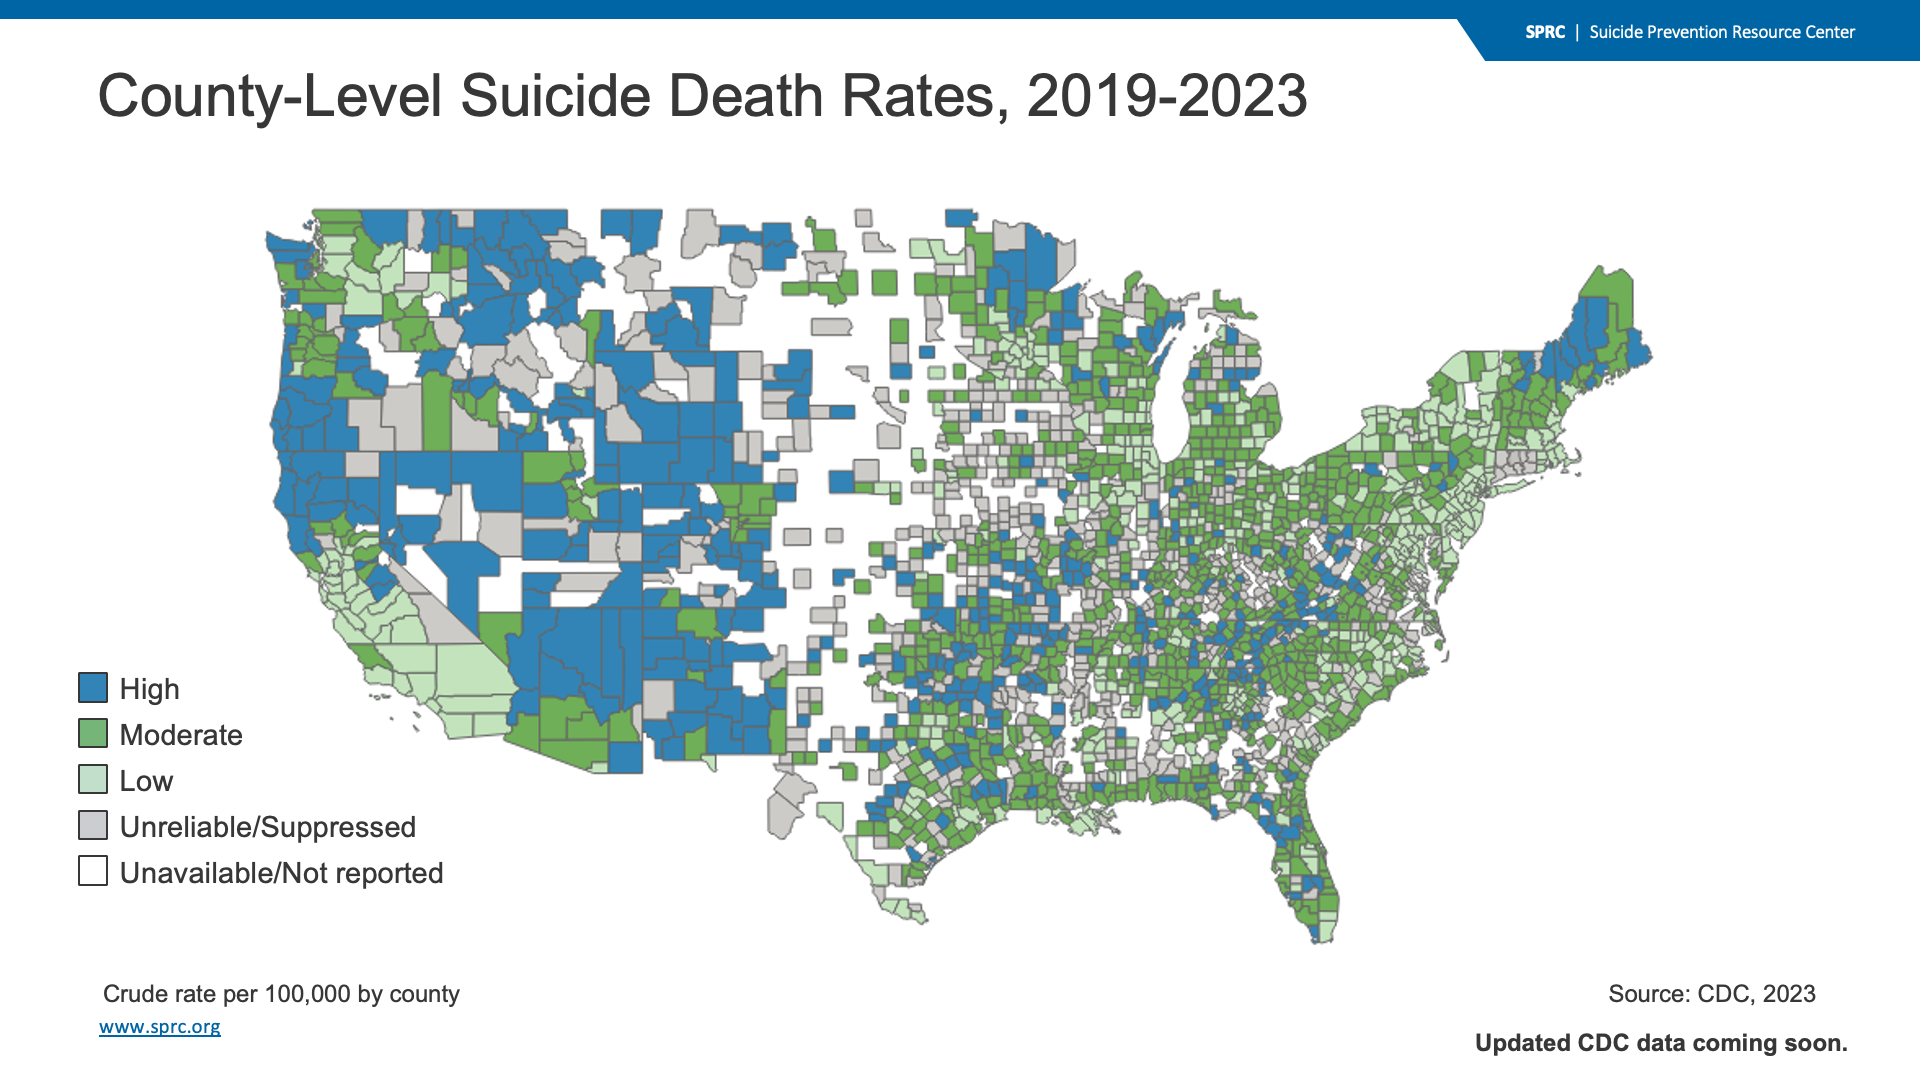
Between 2019 and 2023, suicide death rates were generally highest in Alaska and the western and northwestern United States, but there were parts of southern California, Washington, Minnesota, and Maine where rates were also very high.
High crude rate (blue) ranges represent the top quartile of suicide death rates (22.4 to 121.1 per 100,000) and low crude rate (green) ranges represent the bottom quartile (5 to 14.5 per 100,000). Death rates are unreliable when the rate is calculated with a numerator less than 20; death rates are suppressed when the rate is calculated with a numerator of nine or fewer.
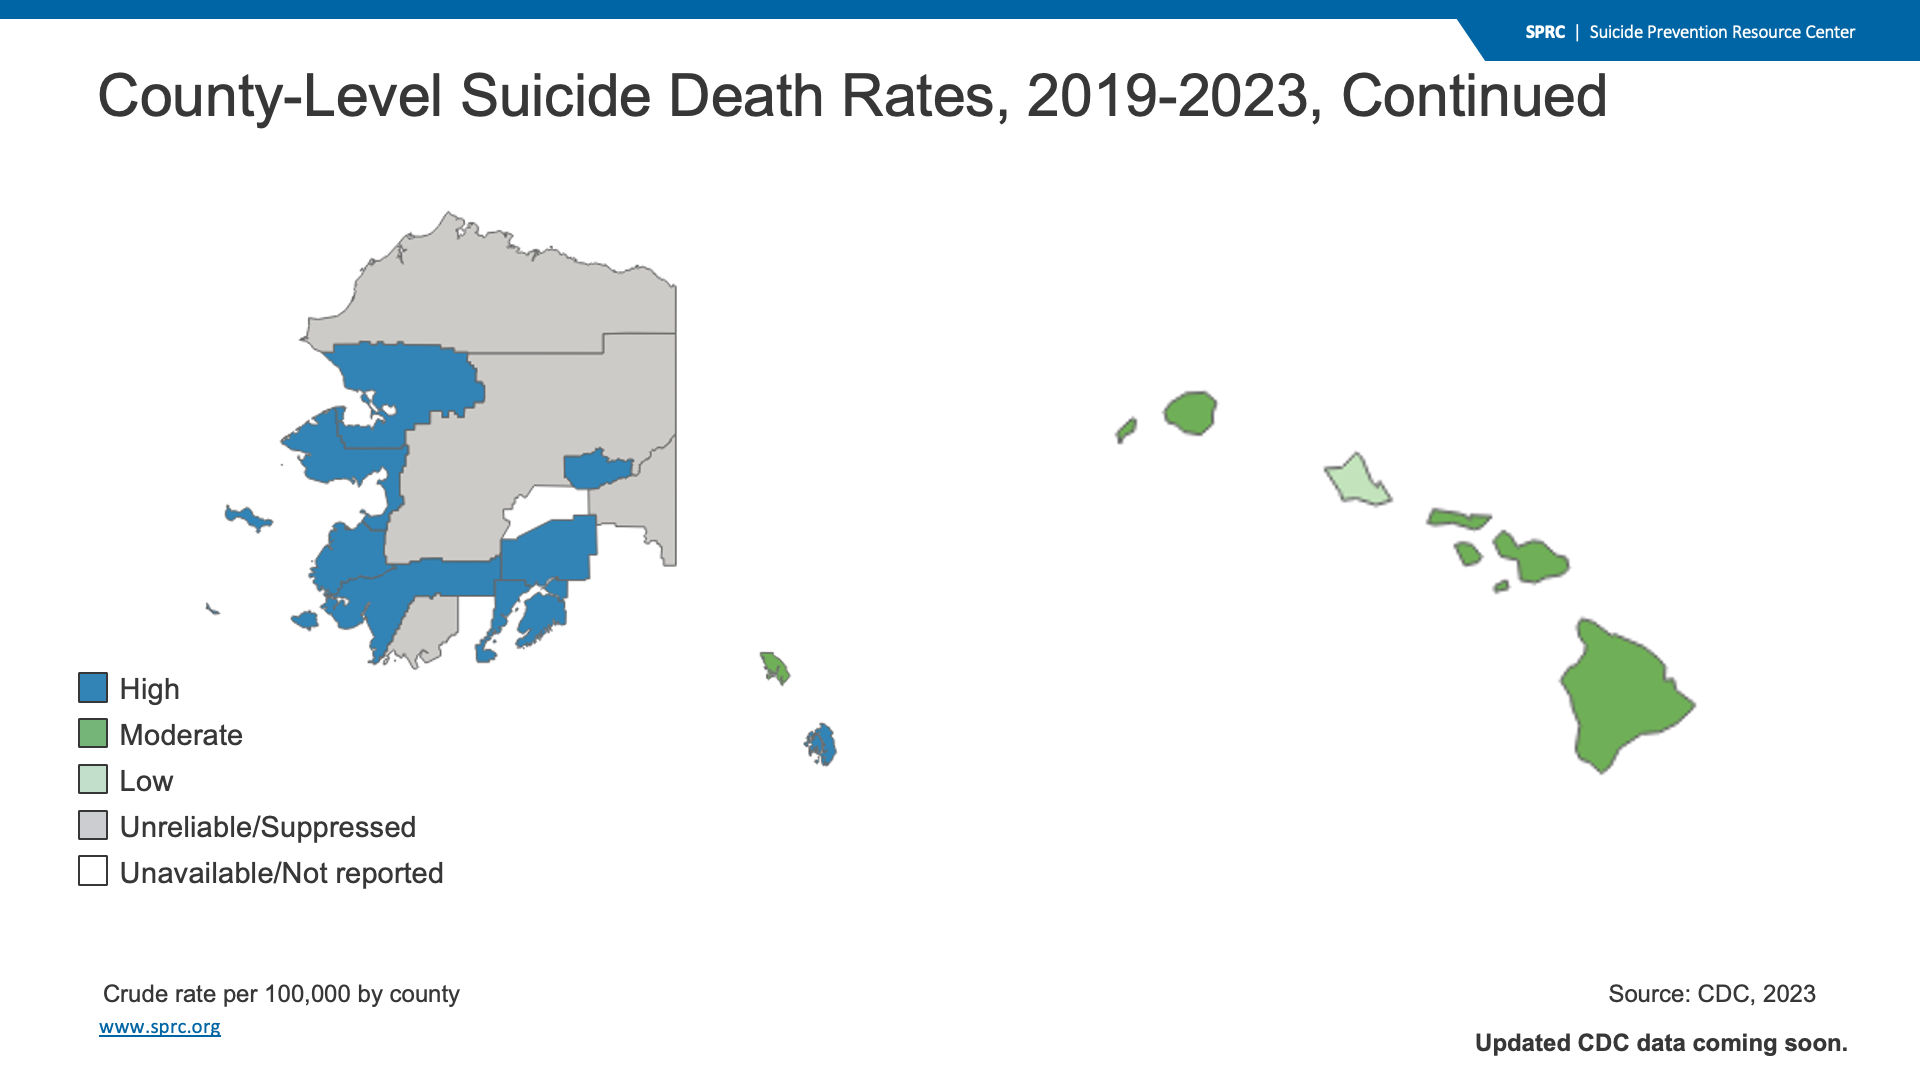
High crude rate (blue) ranges represent the top quartile of suicide death rates (22.4 to 121.1 per 100,000) and low crude rate (green) ranges represent the bottom quartile (5 to 14.5 per 100,000). Death rates are unreliable when the rate is calculated with a numerator less than 20; death rates are suppressed when the rate is calculated with a numerator of nine or fewer.
 | The Suicide in the U.S. charts and graphs are also available as a PowerPoint presentation. |
Suicide Deaths by Drug Poisoning, 2023
Data Table:

Source: CDC, 2023
Citation:
Centers for Disease Control and Prevention, National Center for Injury Prevention and Control. Web-based Injury Statistics Query and Reporting System (WISQARS) [online]) Available from URL: www.wisqars.cdc.gov
Injury Outcome: Fatal
Injury Type: All Injury
Data Years: 2023
Geography: United States
Intent: Suicide
Mechanism: All Injury
Age: All Ages
Sexes: All Sexes
Race: All Races
Ethnicity: All Ethnicities
Metro/Non-Metro Indicator: None Selected
YPLL Age: 65
Centers for Disease Control and Prevention, National Center for Health Statistics. National Vital Statistics System, Mortality 2018-2023 on CDC WONDER Online Database, released in 2024. Data are from the Multiple Cause of Death Files, 2018-2023, as compiled from data provided by the 57 vital statistics jurisdictions through the Vital Statistics Cooperative Program.
MCD – ICD-10 Codes: T40.1 (Heroin); T40.0, T40.2, T40.3 (Opium, Methadone, Other opioids); T40.4 (Other synthetic narcotics); T40.5 (Cocaine), T42.4 (Benzodiazepines); T43.6 (Psychostimulants with abuse potential) AND X60-X84 (Intentional sel-harm)
Year/Month: 2023
Group By: Year
Show Totals: True
Show Zero Values: False
Show Suppressed: False
Calculate Rates Per: 100,000
Rate Options: Default intercensal populations for years 2001-2009 (except Infant Age Groups)
Suicide Rates Among People of More Than One Race in the U.S. by Age, 2019-2023
Data Table:

*Non-Hispanic
**Note. Ages 85+ are not reported because data is unreliable
Crude rate per 100,000
Source: CDC, 2024
Citation:
Centers for Disease Control and Prevention, National Center for Health Statistics. National Vital Statistics System, Mortality 2018-2023 on CDC WONDER Online Database, released in 2024. Data are from the Multiple Cause of Death Files, 2018-2023, as compiled from data provided by the 57 vital statistics jurisdictions through the Vital Statistics Cooperative Program.
Hispanic Origin: Not Hispanic or Latino
ICD-10 Codes: X60-X84 (Intentional self-harm)
Year/Month: 2019; 2020; 2021; 2022; 2023
Group By: Single Race 6; Ten-Year Age Groups
Show Totals: Disabled
Show Zero Values: False
Show Suppressed: False
Calculate Rates Per: 100,000
Rate Options: Default intercensal populations for years 2001-2009 (except Infant Age Groups)
Centers for Disease Control and Prevention, National Center for Health Statistics. National Vital Statistics System, Mortality 2018-2023 on CDC WONDER Online Database, released in 2024. Data are from the Multiple Cause of Death Files, 2018-2023, as compiled from data provided by the 57 vital statistics jurisdictions through the Vital Statistics Cooperative Program.
ICD-10 Codes: X60-X84 (Intentional self-harm)
Year/Month: 2019; 2020; 2021; 2022; 2023
Group By: Ten-Year Age Groups
Show Totals: True
Show Zero Values: False
Show Suppressed: False
Calculate Rates Per: 100,000
Rate Options: Default intercensal populations for years 2001-2009 (except Infant Age Groups)
Suicide Rates Among White People in the U.S. by Age, 2019-2023
Data Table:
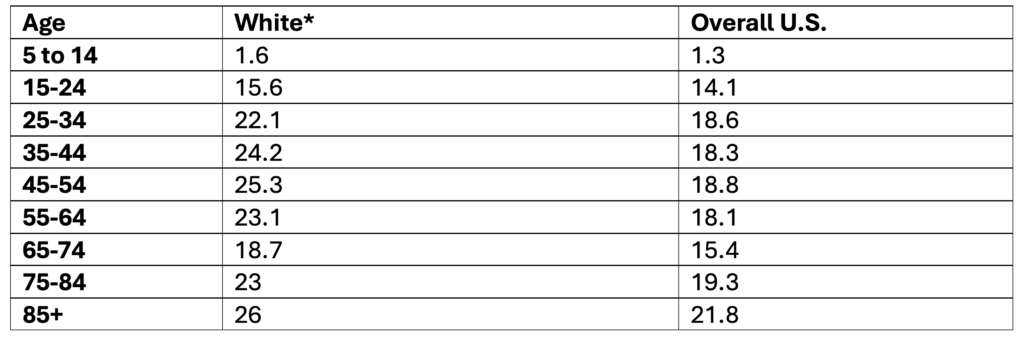
*Non-Hispanic
Crude rate per 100,000
Source: CDC, 2024
Citation:
Centers for Disease Control and Prevention, National Center for Health Statistics. National Vital Statistics System, Mortality 2018-2023 on CDC WONDER Online Database, released in 2024. Data are from the Multiple Cause of Death Files, 2018-2023, as compiled from data provided by the 57 vital statistics jurisdictions through the Vital Statistics Cooperative Program.
Hispanic Origin: Not Hispanic or Latino
ICD-10 Codes: X60-X84 (Intentional self-harm)
Year/Month: 2019; 2020; 2021; 2022; 2023
Group By: Single Race 6; Ten-Year Age Groups
Show Totals: Disabled
Show Zero Values: False
Show Suppressed: False
Calculate Rates Per: 100,000
Rate Options: Default intercensal populations for years 2001-2009 (except Infant Age Groups)
Centers for Disease Control and Prevention, National Center for Health Statistics. National Vital Statistics System, Mortality 2018-2023 on CDC WONDER Online Database, released in 2024. Data are from the Multiple Cause of Death Files, 2018-2023, as compiled from data provided by the 57 vital statistics jurisdictions through the Vital Statistics Cooperative Program.
ICD-10 Codes: X60-X84 (Intentional self-harm)
Year/Month: 2019; 2020; 2021; 2022; 2023
Group By: Ten-Year Age Groups
Show Totals: True
Show Zero Values: False
Show Suppressed: False
Calculate Rates Per: 100,000
Rate Options: Default intercensal populations for years 2001-2009 (except Infant Age Groups)
Suicide Rates Among Native Hawaiian or Other Pacific Islander People by Age, 2019-2023
Data Table:
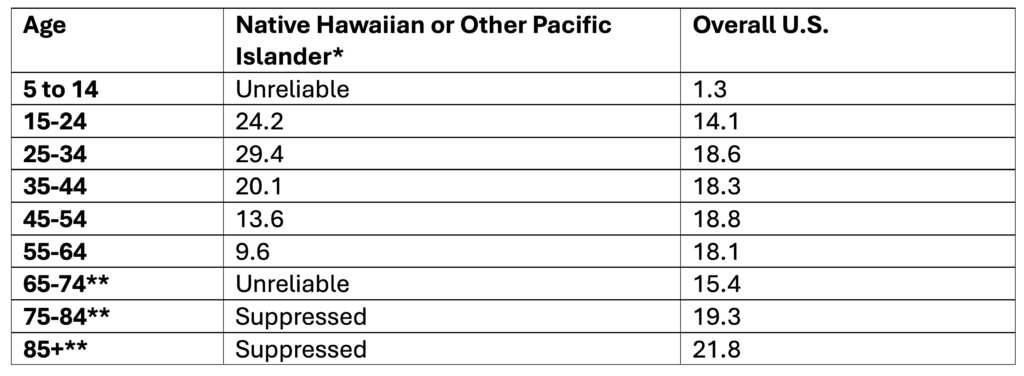
*Non-Hispanic
**Note. Ages 65+ are not reported because data is unreliable
Crude rate per 100,000
Source: CDC, 2024
Citation:
Centers for Disease Control and Prevention, National Center for Health Statistics. National Vital Statistics System, Mortality 2018-2023 on CDC WONDER Online Database, released in 2024. Data are from the Multiple Cause of Death Files, 2018-2023, as compiled from data provided by the 57 vital statistics jurisdictions through the Vital Statistics Cooperative Program.
Hispanic Origin: Not Hispanic or Latino
ICD-10 Codes: X60-X84 (Intentional self-harm)
Year/Month: 2019; 2020; 2021; 2022; 2023
Group By: Single Race 6; Ten-Year Age Groups
Show Totals: Disabled
Show Zero Values: False
Show Suppressed: False
Calculate Rates Per: 100,000
Rate Options: Default intercensal populations for years 2001-2009 (except Infant Age Groups)
Centers for Disease Control and Prevention, National Center for Health Statistics. National Vital Statistics System, Mortality 2018-2023 on CDC WONDER Online Database, released in 2024. Data are from the Multiple Cause of Death Files, 2018-2023, as compiled from data provided by the 57 vital statistics jurisdictions through the Vital Statistics Cooperative Program.
ICD-10 Codes: X60-X84 (Intentional self-harm)
Year/Month: 2019; 2020; 2021; 2022; 2023
Group By: Ten-Year Age Groups
Show Totals: True
Show Zero Values: False
Show Suppressed: False
Calculate Rates Per: 100,000
Rate Options: Default intercensal populations for years 2001-2009 (except Infant Age Groups)
Suicide Rates Among Hispanic or Latino People in the U.S. by Age, 2019-2023
Data Table:
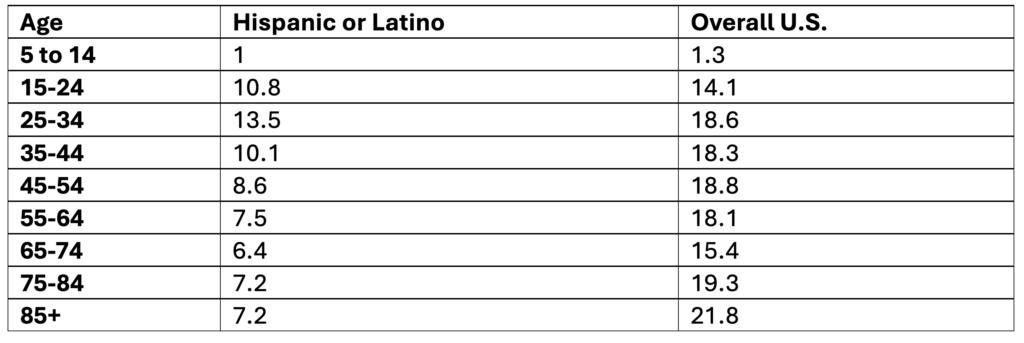
Crude rate per 100,000
Source: CDC, 2024
Citation:
Centers for Disease Control and Prevention, National Center for Health Statistics. National Vital Statistics System, Mortality 2018-2023 on CDC WONDER Online Database, released in 2024. Data are from the Multiple Cause of Death Files, 2018-2023, as compiled from data provided by the 57 vital statistics jurisdictions through the Vital Statistics Cooperative Program.
ICD-10 Codes: X60-X84 (Intentional self-harm)
Year/Month: 2019; 2020; 2021; 2022; 2023
Group By: Hispanic Origin; Ten-Year Age Groups
Show Totals: Disabled
Show Zero Values: False
Show Suppressed: False
Calculate Rates Per: 100,000
Rate Options: Default intercensal populations for years 2001-2009 (except Infant Age Groups)
Centers for Disease Control and Prevention, National Center for Health Statistics. National Vital Statistics System, Mortality 2018-2023 on CDC WONDER Online Database, released in 2024. Data are from the Multiple Cause of Death Files, 2018-2023, as compiled from data provided by the 57 vital statistics jurisdictions through the Vital Statistics Cooperative Program.
ICD-10 Codes: X60-X84 (Intentional self-harm)
Year/Month: 2019; 2020; 2021; 2022; 2023
Group By: Ten-Year Age Groups
Show Totals: True
Show Zero Values: False
Show Suppressed: False
Calculate Rates Per: 100,000
Rate Options: Default intercensal populations for years 2001-2009 (except Infant Age Groups)
Suicide Rates Among Black or African American People by Age, 2019-2023
Data Table:
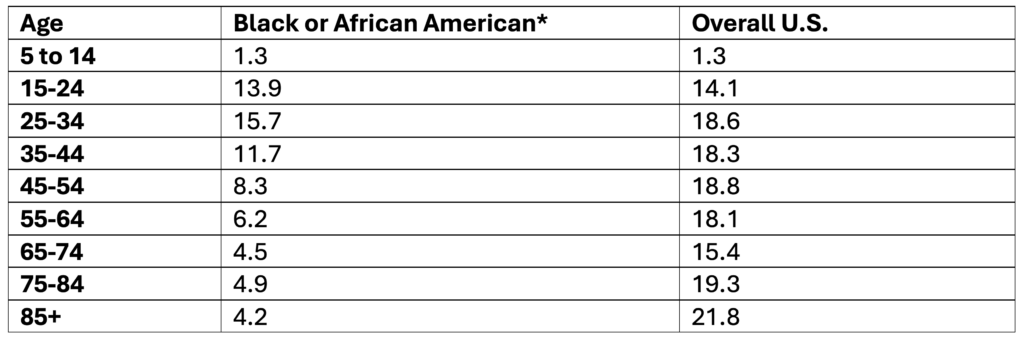
*Non-Hispanic
Crude rate per 100,000
Source: CDC, 2024
Citation:
Centers for Disease Control and Prevention, National Center for Health Statistics. National Vital Statistics System, Mortality 2018-2023 on CDC WONDER Online Database, released in 2024. Data are from the Multiple Cause of Death Files, 2018-2023, as compiled from data provided by the 57 vital statistics jurisdictions through the Vital Statistics Cooperative Program.
Hispanic Origin: Not Hispanic or Latino
ICD-10 Codes: X60-X84 (Intentional self-harm)
Year/Month: 2019; 2020; 2021; 2022; 2023
Group By: Single Race 6; Ten-Year Age Groups
Show Totals: Disabled
Show Zero Values: False
Show Suppressed: False
Calculate Rates Per: 100,000
Rate Options: Default intercensal populations for years 2001-2009 (except Infant Age Groups)
Centers for Disease Control and Prevention, National Center for Health Statistics. National Vital Statistics System, Mortality 2018-2023 on CDC WONDER Online Database, released in 2024. Data are from the Multiple Cause of Death Files, 2018-2023, as compiled from data provided by the 57 vital statistics jurisdictions through the Vital Statistics Cooperative Program.
ICD-10 Codes: X60-X84 (Intentional self-harm)
Year/Month: 2019; 2020; 2021; 2022; 2023
Group By: Ten-Year Age Groups
Show Totals: True
Show Zero Values: False
Show Suppressed: False
Calculate Rates Per: 100,000
Rate Options: Default intercensal populations for years 2001-2009 (except Infant Age Groups)
Suicide Rates Among Asian People in the U.S. by Age, 2019-2023
Data Table:
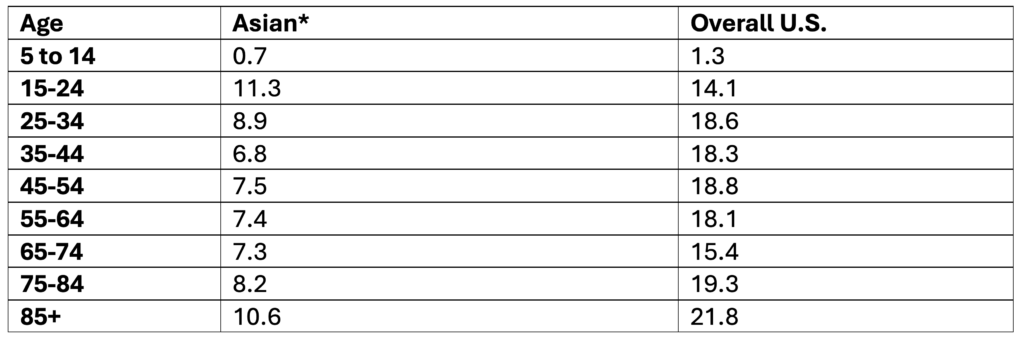
*Non-Hispanic
Crude rate per 100,000
Source: CDC, 2024
Citation:
Centers for Disease Control and Prevention, National Center for Health Statistics. National Vital Statistics System, Mortality 2018-2023 on CDC WONDER Online Database, released in 2024. Data are from the Multiple Cause of Death Files, 2018-2023, as compiled from data provided by the 57 vital statistics jurisdictions through the Vital Statistics Cooperative Program.
Hispanic Origin: Not Hispanic or Latino
ICD-10 Codes: X60-X84 (Intentional self-harm)
Year/Month: 2019; 2020; 2021; 2022; 2023
Group By: Single Race 6; Ten-Year Age Groups
Show Totals: Disabled
Show Zero Values: False
Show Suppressed: False
Calculate Rates Per: 100,000
Rate Options: Default intercensal populations for years 2001-2009 (except Infant Age Groups)
Centers for Disease Control and Prevention, National Center for Health Statistics. National Vital Statistics System, Mortality 2018-2023 on CDC WONDER Online Database, released in 2024. Data are from the Multiple Cause of Death Files, 2018-2023, as compiled from data provided by the 57 vital statistics jurisdictions through the Vital Statistics Cooperative Program.
ICD-10 Codes: X60-X84 (Intentional self-harm)
Year/Month: 2019; 2020; 2021; 2022; 2023
Group By: Ten-Year Age Groups
Show Totals: True
Show Zero Values: False
Show Suppressed: False
Calculate Rates Per: 100,000
Rate Options: Default intercensal populations for years 2001-2009 (except Infant Age Groups)
Suicide Rates Among American Indian and Alaska Native People by Age, 2019-2023
Data Table:
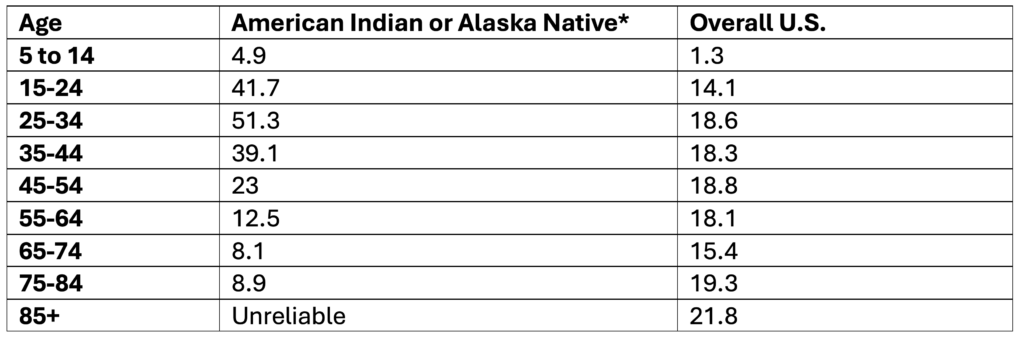
*Non-Hispanic
**Note. Ages 85+ are not reported because data is unreliable
Crude rate per 100,000
Source: CDC, 2024
Citation:
Centers for Disease Control and Prevention, National Center for Health Statistics. National Vital Statistics System, Mortality 2018-2023 on CDC WONDER Online Database, released in 2024. Data are from the Multiple Cause of Death Files, 2018-2023, as compiled from data provided by the 57 vital statistics jurisdictions through the Vital Statistics Cooperative Program.
Hispanic Origin: Not Hispanic or Latino
ICD-10 Codes: X60-X84 (Intentional self-harm)
Year/Month: 2019; 2020; 2021; 2022; 2023
Group By: Single Race 6; Ten-Year Age Groups
Show Totals: Disabled
Show Zero Values: False
Show Suppressed: False
Calculate Rates Per: 100,000
Rate Options: Default intercensal populations for years 2001-2009 (except Infant Age Groups)
Centers for Disease Control and Prevention, National Center for Health Statistics. National Vital Statistics System, Mortality 2018-2023 on CDC WONDER Online Database, released in 2024. Data are from the Multiple Cause of Death Files, 2018-2023, as compiled from data provided by the 57 vital statistics jurisdictions through the Vital Statistics Cooperative Program.
ICD-10 Codes: X60-X84 (Intentional self-harm)
Year/Month: 2019; 2020; 2021; 2022; 2023
Group By: Ten-Year Age Groups
Show Totals: True
Show Zero Values: False
Show Suppressed: False
Calculate Rates Per: 100,000
Rate Options: Default intercensal populations for years 2001-2009 (except Infant Age Groups)
Past-Year Suicidal Thoughts and Behaviors Among High School Youth, 2023
Data Table:
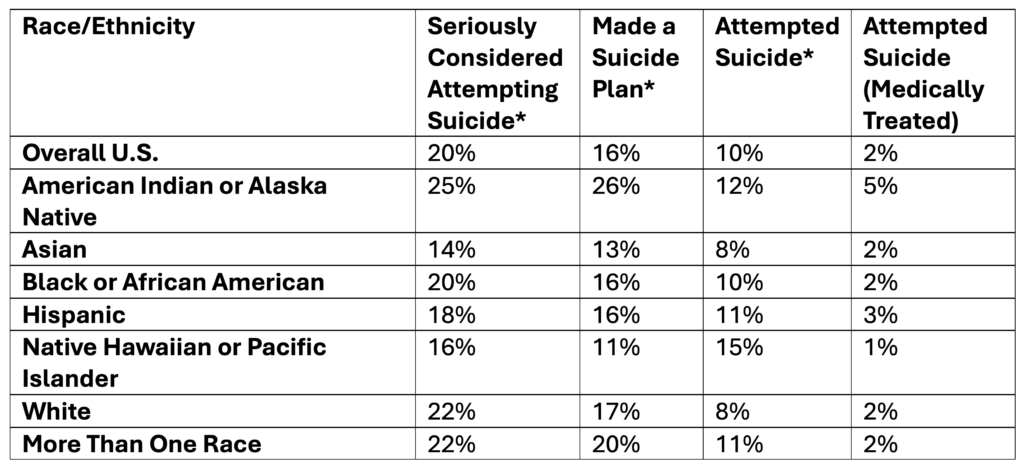
*Self-Reported
Source: CDC, 2025
Citation:
Centers for Disease Control and Prevention (CDC). (2025). 1991-2023 High School Youth Risk Behavior Survey Data. Available at http://yrbs-explorer.services.cdc.gov/.
Past-Year Self-Reported Suicidal Thoughts and Suicide Attempts Among Adults, 2024
Data Table:
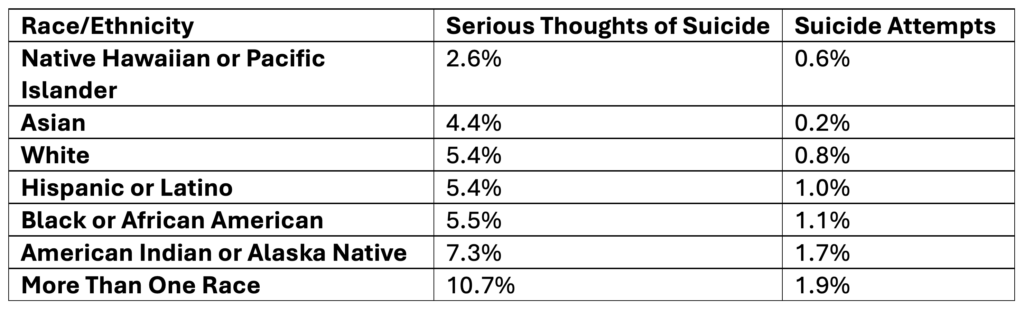
Source: SAMHSA, 2025
Citation:
U.S. Department of Health and Human Services, Substance Abuse and Mental Health Services Administration, Center for Behavioral Health Statistics and Quality. (2025). National Survey on Drug Use and Health 2024 (NSDUH-2024-DS001). Retrieved from https://www.samhsa.gov/data/
Tables: 6.71B & 6.73B
Rates of Suicide by Race/Ethnicity, 2019-2023
Data Table:
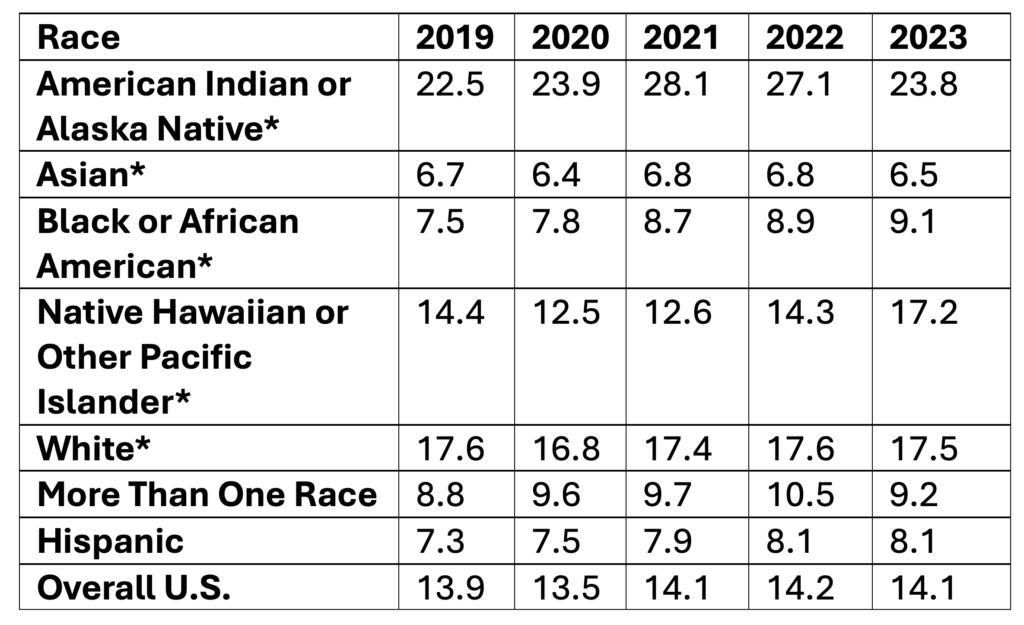
*Non-Hispanic
Age-adjusted rate per 100,000
Source: CDC, 2024
Citation:
Centers for Disease Control and Prevention, National Center for Health Statistics. National Vital Statistics System, Mortality 2018-2023 on CDC WONDER Online Database, released in 2024. Data are from the Multiple Cause of Death Files, 2018-2023, as compiled from data provided by the 57 vital statistics jurisdictions through the Vital Statistics Cooperative Program.
Hispanic Origin: Not Hispanic or Latino
ICD-10 Codes: X60-X84 (Intentional self-harm)
Year/Month: 2019; 2020; 2021; 2022; 2023
Group By: Year; Single Race 6
Show Totals: True
Show Zero Values: False
Show Suppressed: False
Standard Population: 2000 U.S. Std. Population
Calculate Rates Per: 100,000
Rate Options: Default intercensal populations for years 2001-2009 (except Infant Age Groups)
Centers for Disease Control and Prevention, National Center for Health Statistics. National Vital Statistics System, Mortality 2018-2023 on CDC WONDER Online Database, released in 2024. Data are from the Multiple Cause of Death Files, 2018-2023, as compiled from data provided by the 57 vital statistics jurisdictions through the Vital Statistics Cooperative Program.
ICD-10 Codes: X60-X84 (Intentional self-harm)
Year/Month: 2019; 2020; 2021; 2022; 2023
Group By: Year; Hispanic Origin
Show Totals: True
Show Zero Values: False
Show Suppressed: False
Standard Population: 2000 U.S. Std. Population
Calculate Rates Per: 100,000
Rate Options: Default intercensal populations for years 2001-2009 (except Infant Age Groups)
Suicide Rates by Age, 2019-2023
Data Table:
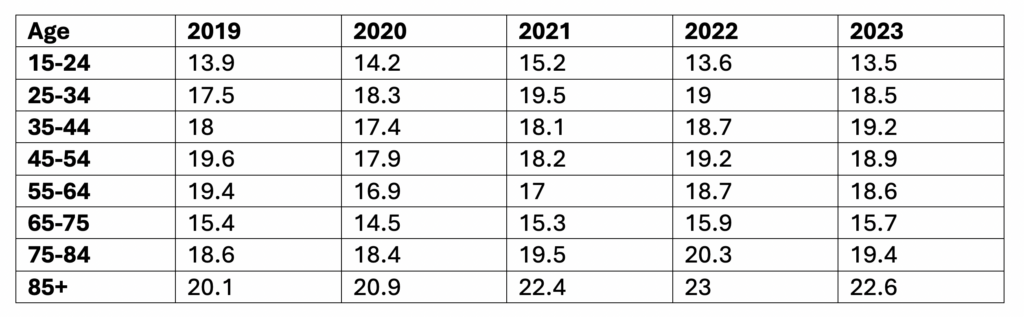
Crude rate per 100,000
Source: CDC, 2024
Citation:
Centers for Disease Control and Prevention, National Center for Health Statistics. National Vital Statistics System, Mortality 2018-2023 on CDC WONDER Online Database, released in 2024. Data are from the Multiple Cause of Death Files, 2018-2023, as compiled from data provided by the 57 vital statistics jurisdictions through the Vital Statistics Cooperative Program.
ICD-10 Codes: X60-X84 (Intentional self-harm)
Year/Month: 2019; 2020; 2021; 2022; 2023
Group By: Year, Ten-Year Age Groups
Show Totals: Disabled
Show Zero Values: False
Show Suppressed: False
Calculate Rates Per: 100,000
Rate Options: Default intercensal populations for years 2001-2009 (except Infant Age Groups)