Suicide and Opioids
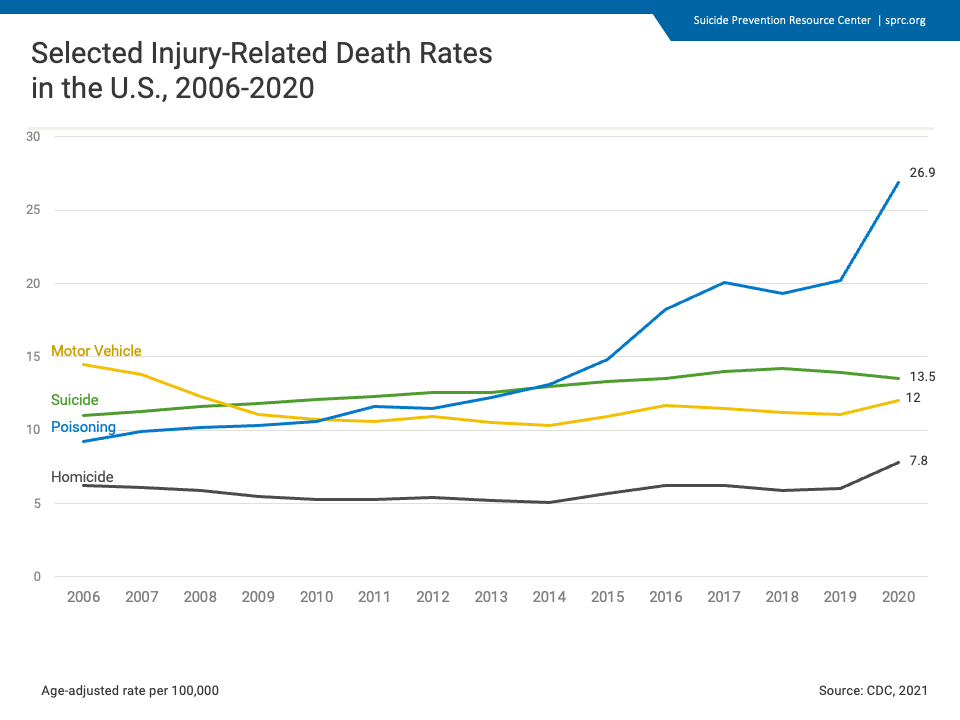
This graph represents age-adjusted death rates over a 15-year period. Motor vehicle death rates decreased from 2006 to 2014, then rose steadily until 2020. Suicide death rates saw a steady increase from 2006 to 2020. Unintentional poisonings sharply increased from 2006 to 2020. Homicides remained steady at a lower rate than the other three causes of death, with an uptick from 2019 to 2020.1
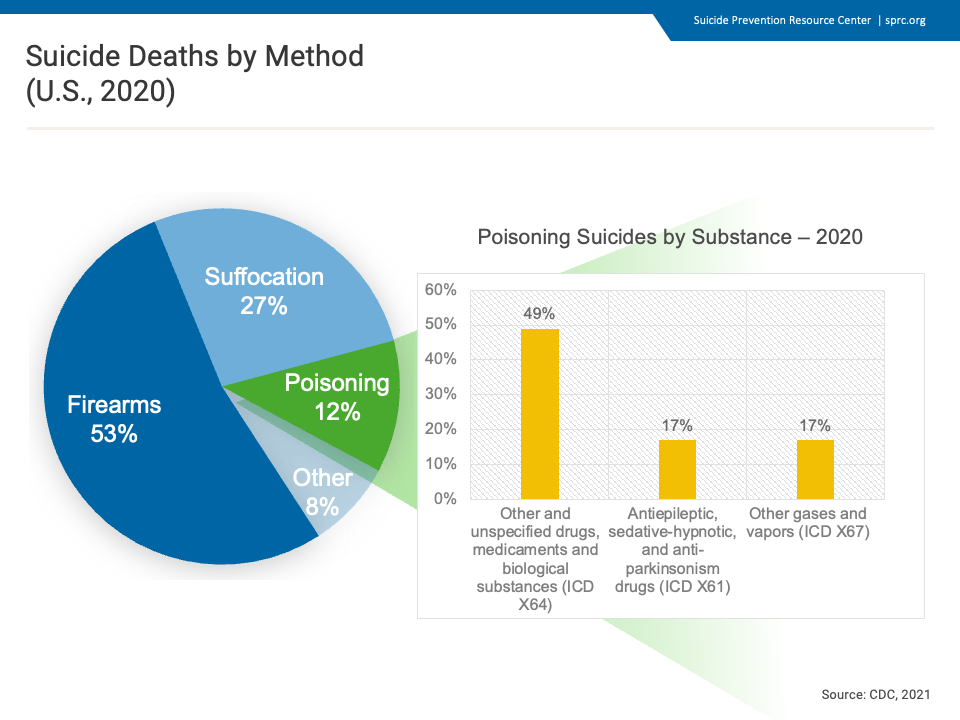
This pie chart illustrates suicide deaths by various means. In 2020 firearms accounted for a majority (53%) of the deaths by suicide, followed by suffocation (27%), and other (8%). Poisonings accounted for 12% of suicide deaths. The accompanying bar graph illustrates the various substances used in suicide deaths by poisoning. As the graph shows, other and unspecified drugs, medicaments, and biological substances were contributors in over 49% of poisoning deaths.1
References
- Centers for Disease Control and Prevention. (2021). 1999-2020 Wide ranging online data for epidemiological research (WONDER), multiple cause of death files [Data file]. National Center for Health Statistics. http://wonder.cdc.gov/ucd-icd10.html
 | The charts and graphs in this section are also available as a PowerPoint slide set. Feel free to use this slide set to deliver a presentation about the scope of the suicide problem. |
Centers for Disease Control and Prevention, National Center for Health Statistics. National Vital Statistics System, Mortality 2018-2023 on CDC WONDER Online Database, released in 2024. Data are from the Multiple Cause of Death Files, 2018-2023, as compiled from data provided by the 57 vital statistics jurisdictions through the Vital Statistics Cooperative Program.
Hispanic Origin: Not Hispanic or Latino
ICD-10 Codes: X60-X84 (Intentional self-harm)
Year/Month: 2019; 2020; 2021; 2022; 2023
Group By: Year; Single Race 6
Show Totals: True
Show Zero Values: False
Show Suppressed: False
Standard Population: 2000 U.S. Std. Population
Calculate Rates Per: 100,000
Rate Options: Default intercensal populations for years 2001-2009 (except Infant Age Groups)
Centers for Disease Control and Prevention, National Center for Health Statistics. National Vital Statistics System, Mortality 2018-2023 on CDC WONDER Online Database, released in 2024. Data are from the Multiple Cause of Death Files, 2018-2023, as compiled from data provided by the 57 vital statistics jurisdictions through the Vital Statistics Cooperative Program.
ICD-10 Codes: X60-X84 (Intentional self-harm)
Year/Month: 2019; 2020; 2021; 2022; 2023
Group By: Year; Hispanic Origin
Show Totals: True
Show Zero Values: False
Show Suppressed: False
Standard Population: 2000 U.S. Std. Population
Calculate Rates Per: 100,000
Rate Options: Default intercensal populations for years 2001-2009 (except Infant Age Groups)
Request Technical Assistance
If you are seeking individualized suicide prevention training and support, please fill out our Contact Us form.
The Puerto Rico Department of Health (PRDoH)’s Commission on Suicide Prevention, which receives funding from the CDC Comprehensive Suicide Prevention Program, has implemented a Media Monitoring and Recommendation Initiative to ensure that suicide-related news coverage adheres to ethical standards while promoting awareness and prevention resources. Recognizing the critical role of the media in shaping public perception, the PRDoH proactively monitors local media, as well as social media platforms, to identify harmful reporting practices and provide constructive feedback.
Through regular communication with journalists, editors, and digital content creators, the PRDoH provides evidence-based recommendations on suicide reporting and recognizes media outlets that adhere to best practices to reinforce positive reporting behavior. In addition, the PRDoH builds media capacity through its free online course for journalists and content creators, called “The Role of Media in Suicide Prevention.” Some results of these efforts include:
• Articles featuring safer images, such as depicting a helpline instead of including a photo of the deceased
• A shift to safer content, such as a brief note of a death being investigated as a suicide rather than graphic descriptions of method
• Inclusion of the 988 Lifeline
• Replacing stigmatizing language with appropriate language (such as “died by suicide”)
• Improved media relationships
• Broader public exposure to the 988 Lifeline
Although time consuming, these efforts have helped build trust with local media outlets. By reaching out directly to journalists, being consistent with guidelines, and providing suicide data and local resources for the media to share, the PRDoH has created positive shifts to promote help-seeking behavior and increase suicide prevention awareness in Puerto Rico.
The Michigan Department of Health and Human Services (MDHHS) Preventing Suicide in Michigan Men Program, funded by the CDC’s Comprehensive Suicide Prevention Grant program, uses communication strategies that incorporate suicide-centered lived experience perspectives and promote the use of safe messaging. As part of this program, in 2022 MDHHS created and disseminated a paid media campaign intended to increase help-seeking behaviors among adult men in Michigan through storytelling. The campaign was created with the participation of three Michigan men with suicide-centered lived experience whose stories were featured in the campaign. It focuses on hope and resilience and encourages men to reach out for help. The tagline of the campaign is: “Speak up. The life you save could be your own.”
In 2023 MDHHS partnered with the developers of the Tool for Evaluating Media Portrayals of Suicide (TEMPOS) and individuals from the University of Michigan to host safe messaging training webinars. Over 150 media and public health professionals attended the events. On post-webinar evaluation surveys, 90% of respondents said the webinar increased their understanding of the risks associated with communications about mental health and suicide and 93% said that they were very likely or somewhat likely to use the TEMPOS tool in the future.
Never a Bother, the California Department of Public Health’s (CDPH) youth suicide prevention campaign, was launched in the spring of 2024. By the end of that year, it had garnered over 726 million overall campaign views. The campaign takes a youth-centered approach and employs strategies for effective youth engagement and co-creation. Never a Bother combines traditional media efforts (billboards, commercials, outreach materials) with grants to youth-serving community-based organizations and Tribal entities. These grants are intended to foster the use of evidence-informed and community-based suicide prevention strategies. This model engages trusted community messengers to amplify and reinforce the campaign’s messages at the local level.
Using focused, safe, positive, and community specific messaging, combined with stories from youth with suicide-centered lived experience, the campaign seeks to increase awareness and use of resources, services, and supports, while offering hope to those who need it most. The Never a Bother website has resources for both youth and caregivers about how to support youth before, during, and after a crisis, including postvention communication resources. The campaign website and the campaign’s Instagram and YouTube channels also showcase stories from youth and caregivers, as well as videos on safe messaging and what happens when you call 988. These efforts help ensure the campaign is customized by and for different communities and further extend Never a Bother’s messaging, reach, and impact.
Washington’s House Bill 2315 requires suicide prevention continuing education at differing levels of depth for all mental health and health professionals, ranging from social workers to chiropractors to dentists. The Washington State Department of Health (WSDH) maintains a list of suicide-specific CEU requirements for the different professions, as well as a list of approved training opportunities that professionals can choose from to obtain CEUs. Only trainings reviewed and confirmed as meeting WSDH’s preset minimum education standards are included in the list.
Pennsylvania’s Act 71/House Bill 1559 requires all school districts to create and implement suicide prevention policies and provide four cumulative hours of suicide prevention training for all 6-12th grade educators every five years. To support schools in meeting this requirement, Pennsylvania developed a variety of free online courses that are available on Prevent Suicide PA’s Online Learning Center. Several of these trainings were developed specifically for educators. There are continuous efforts to expand course offerings to address specific risk factors, overview interventions and treatment approaches, and highlight the needs of populations at increased risk. Additionally, Pennsylvania has worked to maintain an updated list of trainings that schools may consider to help meet the state’s requirements.
South Carolina’s Code of Law Section 59-26-110requires all middle and high school educators to participate in two hours of suicide prevention continuing education for credential renewal. To help school educators meet this requirement, the South Carolina Department of Education’s Office of Educator Effectiveness and Leadership Development (OEELD) partnered with the South Carolina chapter of the American Foundation for Suicide Prevention (AFSP) to offer the More Than Sad program. The OEELD helps to promote More Than Sad opportunities and the South Carolina AFSP chapter offers schools free trainings-for-trainers through an agreement with the South Carolina Youth Suicide Prevention Initiative.
California passed Assembly Bill 2246 in 2016, which requires grade 7-12 public schools to develop and implement comprehensive suicide prevention policies, including guidance on suicide prevention training for teachers. The bill also includes language that requires the state to provide funding to support suicide prevention policies and training in public schools. After the bill passed, former Governor Jerry Brown approved the 2018–19 state budget, which designated $1.7 million to the Department of Education to cover the cost of suicide prevention training. More recently, the Department of Education has collaborated with mental health professionals, including the Student Mental Health Policy Workgroup, to provide a Model Youth Suicide Prevention Policy.
The Indiana Division of Mental Health and Addiction (DMHA) provides the state’s local suicide prevention coalitions with a suicide prevention planning tool that offers guidance on working with partners, assessing communities, action planning, and engaging the media. To further support local coalitions, Indiana contracted with Mental Health America of Indiana’s Indiana Suicide Prevention Network (ISPN) to fund a director role responsible for managing and maintaining the ISPN, providing technical assistance support to local coalitions, and disseminating the state suicide prevention plan and framework to partners and communities.
Indiana funded the full-time ISPN director role through Indiana’s Mental Health Block Grant to meet the state’s need for sustainable systems infrastructure to support suicide prevention efforts. The DMHA also contracted with Education Development Center to coordinate statewide suicide prevention infrastructure plans that further support public and private buy-in adoption of the state suicide prevention plan and efforts.
The Texas Health and Human Services Commission partners with the Texas Suicide Prevention Collaborative to support the efforts of a statewide suicide prevention council as well as the state’s regional suicide prevention coalitions. The collaborative provides ongoing support to these regional coalitions via trainings, website maintenance, toolkits, one-pagers, and more. These supports increase statewide capacity to consistently and effectively implement suicide prevention strategies at the local level.
The Ohio Suicide Prevention Foundation (OSPF) conducts frequent surveys, community listening sessions, focus groups, and needs assessments with Suicide Prevention Coalitions, L.O.S.S. Teams, and other community-level partners in the state to understand the local needs of people at risk for suicide. These activities track growth in coalitions, L.O.S.S. Teams, and communities to gather information about strategies being implemented and areas that require intervention and collaboration.
OSPF also regularly hosts learning opportunities focused on suicide prevention and strategic planning topics that align with expressed needs. All OSPF efforts take a quality improvement and quality assurance approach to comprehensive suicide prevention. Additionally, the Suicide Prevention Plan for Ohio’s Implementation Team ensures that all initiatives, demographic groups, and communities receive evaluation supports at the state and local levels.
In 2023, the Missouri Department of Mental Health worked closely with Partners in Prevention and Education Development Center to facilitate the first ever Suicide Prevention Coalition Academy in the United States. The academy was designed to provide guidance to community coalitions on implementing sustainable, evidence-based suicide prevention efforts using the newly developed Community-Led Suicide Prevention Toolkit. The academy included a two-day, in-person event followed by virtual community of practice sessions each month for a year. The academy objectives were aimed at providing coalitions with the information and skills to successfully adopt or expand suicide prevention efforts, assisting coalitions in developing and implementing strategic plans, and creating collaborations among community coalitions and other agencies to provide mentorship and support. A similar academy is being planned for the near future.
The South Carolina Department of Mental Health (SCDMH) offers services through 16 community mental health centers, clinics, inpatient psychiatric hospitals, a substance use treatment facility, a community nursing care center, and three nursing homes for veterans. SCDMH provided these health systems with sample policies to support implementation and tracking of the Columbia Suicide Severity Rating Scale (C-SSRS) through electronic health records. While implementation of the C-SSRS is not legislatively mandated, SCDMH monitors C-SSRS use via electronic record review to ensure that all patients who enter a publicly funded center are screened for suicide risk.
Each year, the North Carolina Division of Public Health (NCDPH), Injury and Violence Prevention Branch submits suicide prevention strategies to the NCDPH Healthy Communities Program to be implemented by county health departments. Each year, the local health departments must select and implement at least two chronic disease and injury prevention strategies related to different topics, which may include suicide prevention. Health departments that implement suicide prevention strategies are required to host at least one of four suicide prevention gatekeeper trainings: Applied Suicide Intervention Skills Training (ASIST), Counseling on Access to Lethal Means (CALM), Mental Health First Aid (MHFA), or Question, Persuade, Refer (QPR) for community-based agencies in their districts. To make suicide prevention programs more accessible, North Carolina inventoried programs in the state that are involved in suicide prevention and created a searchable public-facing map. Programs can submit their names for inclusion on the map online.
Prevent Suicide Wisconsin (PSW), convened by Mental Health America of Wisconsin, leads the state’s suicide prevention programming through a grant from the Wisconsin Department of Health Services. In collaboration with the Medical College of Wisconsin–Division of Suicide Research and Healing in the Comprehensive Injury Center, PSW leads ongoing efforts to improve data collection for surveillance of suicide and evaluation of prevention efforts.
In 2014, PSW released a public report that analyzed state trends and identified key risk and protective factors that Wisconsin’s suicide prevention plan should address. A newer report, Suicide in Wisconsin: Impact and Response (2020), provides program guidance and policy recommendations. The report also links surveillance data sources with specific prevention strategies to better evaluate the results of the state plan. It serves as a call to action, providing tangible steps and resources that can be used in various settings and with different populations.
Suicide Prevention Center of New York (SPCNY) has increased its capacity to evaluate the impact of its activities on the state’s suicide morbidity, mortality, and risk and protective factors. It established in-house evaluation capacity and leveraged inter- and intra-agency partnerships to further progress toward its evaluation goals. Evaluation results are shared with agency leadership, funding bodies, project advisory committees, the NYS Suicide Prevention Council, and public resource repositories such as SPRC’s Best Practices Registry. SPCNY has learned that inter-agency partnerships are crucial for robust program evaluation.
SPCNY hired a psychiatric epidemiologist and implementation director to help bring a structured approach to programming, research, and the development of data collection tools. It has built and evaluated robust programs in NYS, such as CARES UP for first responders and corrections officers, Zero Suicide, and DBT-STEPS A.
To support a multifaceted approach to suicide prevention, Utah’s state budget line items for suicide prevention fund two key state-level staff positions, psychiatric consultation programs, grants to support local education agencies in implementing suicide prevention strategies, and grants to communities implementing suicide prevention, intervention, and postvention strategies. Additionally, the Governor’s Suicide Prevention Fund can receive both individual donations from Utah citizens and tax check-off donations (which allow citizens to elect to have a portion of their tax return donated to the statewide fund). The fund provides suicide prevention grants to businesses, higher education institutions, and local coalitions. It also supports the highly visible LiveOnUtah.org suicide prevention campaign. By purchasing a Live On Utah license plate, citizens can make a $25 donation to the Governor’s Suicide Prevention Fund.
Massachusetts has an $8 million budget line item for suicide prevention that ensures sustainable funding. The budget line item supports the commonwealth’s Suicide Prevention Program, which funds education and training for caregivers, professionals, and community helpers; state agencies working with veterans, older adults, and those living with serious mental illness; a statewide coalition and 10 regional coalitions that represent local suicide prevention needs; the 988 Suicide & Crisis Lifeline network; and additional prevention, intervention, and postvention activities across the lifespan.
The Connecticut Department of Mental Health & Addiction Services (DMHAS), United Way of Connecticut/211, Vanguard, and multiple other partners created Gizmo’s Pawesome Guide to Mental Health© and associated elementary curriculum in 2017–2018. This curriculum educates children on a variety of upstream prevention topics, such as understanding mental health and how it is connected to physical health, healthy and safe coping strategies, and how to create plans to address mental health. Over 40,000 guides have been distributed in the U.S., Canada, and Australia. American Foundation for Suicide Prevention chapters host Gizmo read-alongs. The curriculum, which engages children in positive mental health practices, has been disseminated to 40+ school systems across the U.S. and Canada. It helps children identify trusted adults to increase social connectedness and its resources and activities contribute to reducing shared risk factors and strengthening shared protective factors for mental illness, substance use disorders, and suicide.
In 2015, Oregon passed Senate Bill 561 requiring the creation of a post-suicide community response plan to support community partners in case of a suspected death by suicide of a youth or young adult age 24 or younger. Each local mental health authority is required to have a communication plan and response protocol for youth suicide deaths, and they can request technical assistance or support from the Oregon Health Authority. In 2017, the Oregon Health Authority launched the Suicide Rapid Response Program to increase available supports for local communities experiencing limited or fatigued resources in a post-suicide response. Through this process, Oregon has learned that each postvention response to a suicide death is unique and depends on the geographic and cultural makeup of the community. For this reason, Oregon has increased the availability of culturally specific post-suicide supports through partnerships with Tribal organizations and Latine and Spanish-speaking providers.
The Ohio Suicide Prevention Foundation (OSPF) coalitions are currently made up of 70+ coalition leaders from across Ohio who represent local county coalition groups. These coalitions build and strengthen community awareness about suicide prevention and postvention in the state. OSPF holds bi-monthly meetings to address statewide suicide prevention and postvention areas of concern and provide expert-led trainings to strengthen and sustain coalition work. The Suicide Prevention Plan for Ohio includes a special focus on implementing best practices for populations of Ohioans experiencing disproportionately high suicide rates. It highlights the importance of monitoring which groups are experiencing higher rates of suicide at the state and local levels, and where change is happening in suicide-related outcomes over time. These populations include, but are not limited to, Ohioans living in rural and Appalachian regions, males, young adults, Black Ohioans, and veterans.
New Hampshire’s ConnectTM program is a comprehensive model for planning and implementing suicide prevention and postvention practices. Through this program, New Hampshire prepares local prevention leaders to work with community partners to implement evidence-based postvention approaches and develop community-specific suicide response protocols. These protocols help communities respond quickly and effectively to local suicides by specifying which partners should be involved in postvention, which community members should be contacted following a suicide, which services will be provided to those affected, and how the media will ensure safe messaging. The ConnectTM program has recently been adapted to better address the needs of populations disproportionately impacted by suicide. It now includes trainings for people who are deaf and hard of hearing and LGBTQIA2S+ populations, as well as online suicide prevention trainings in Spanish.
In Connecticut, the Department of Mental Health and Addiction Services (DMHAS) and Department of Children and Families (DCF) fund the Connecticut 988 Contact Center, which is operated by the United Way of Connecticut/211. Services provided by the 988 Contact Center include rapid 24/7 access to trained staff who can help people experiencing suicidal, substance use, and other mental health crises. The contact center staff also provide referrals to resources and warm transfers to 24/7/365 mobile crisis services or emergency services as needed or desired for youth and adults. There is no wrong way to reach crisis services in Connecticut. People can call 211 or 988, text 988, or chat at www.988lifeline.org.
Arizona developed a crisis response system to facilitate collaborations among crisis service agencies. The system allows agencies to provide appropriate levels of treatment for individuals in crisis. Arizona’s crisis response system is regionally based and offers the following:
– A crisis call center with a peer warmline and formal crisis line
– Community-based mobile crisis teams that can be dispatched to those in need
– Immediate crisis facilities that can receive walk-ins and short-term referrals from mobile crisis teams and first responders
– Inpatient and outpatient behavioral health care providers that receive referrals from the crisis call centers, crisis teams, and crisis facilities.
Maryland’s House Bill 1302 is an Extreme Risk Protection Order Act that allows family, household members, and law enforcement to directly petition certain courts or a district commissioner to temporarily remove firearms from an individual who shows warning signs indicating that they are a significant danger to themselves or others.
Texas Health and Safety Code § 1001.201 – §1001.206; §1001.2031 mandates that the state’s Health and Human Services Commission allocate annual grant funding to local mental health authorities for training Mental Health First Aid (MHFA) instructors and providing MHFA training to school district employees, first responders, military service members, veterans and their families, judges and attorneys, youth, and individuals with direct and recurring contact with students.
Minnesota Statute 145.56 mandated that the state revise and implement its Suicide Prevention State Plan to reflect a public health approach that is evidence-based and addresses suicide prevention across the lifespan. The statute further directed Minnesota to fund community-based suicide prevention programs and education for families, organizations, K-12 schools, higher education, workplaces, and health care. The resulting plan provides a comprehensive set of goals, objectives, and action steps to ensure that statewide suicide prevention efforts are implemented through the work of state, Tribal, and community partners.
Suicide Prevention Center of New York (SPCNY) has long advocated for preventing suicide across the lifespan. For example, SPCNY is taking a multi-tiered approach to supporting youth in schools and working-age men in high-risk fields. Pilot programs to screen for social isolation and loneliness among older adults in primary care settings are planned for 2024. Zero Suicide activities across the lifespan also continue to be robust in the state.
SPCNY regularly analyzes morbidity and mortality data using a lifespan perspective to inform prevention efforts among New Yorkers at all life stages. Whenever possible, social disparities in trends are examined simultaneously to identify and assess health equity concerns and approaches are then tailored to the needs of specific populations. New York ensures its lifespan approach by developing and supporting community-based coalitions that guide local efforts, investing in gatekeeper trainings for a variety of populations, and implementing K-12 suicide prevention programs.
In 2021, the Vermont Health Department initiated the state’s first Suicide Data Linkage Report, which provides an in-depth look at how people who died by suicide interacted with state agencies and other organizations during their lives. It also identifies ways the state’s prevention efforts could be improved. Data were compiled through signed memoranda from 12 different state and community partners and included health care claims and data from the judicial system, law enforcement, corrections, services for older Vermonters, public housing, family and economic services, and the Vermont Violent Death Reporting System.
The analysis helped Vermont identify common incidents, circumstances, and risk factors present prior to suicide deaths. The state is using findings from the analysis to inform the development of Vermont’s first suicide prevention strategic plan and improve identification and support of individuals at risk for suicide.
South Carolina’s Revenue and Fiscal Affairs Office oversees a health and demographics database. The database is authorized through SC Code of Law Section 44-6-170 to receive data from state emergency departments; providing these data is now part of emergency departments’ annual license renewal process. Revenue and Fiscal Affairs and hospitals are reimbursed for data collection and reporting costs. A formal, public-private data oversight council directs data collection and the process of linking data variables to state agency data sets (e.g., Vital Statistics). The council also approves the release of data to research partners.
Suicide prevention efforts in South Carolina have benefited from being able to pull data from this system and link these data with the South Carolina Department of Mental Health’s database. For example, suicide prevention efforts are now able to focus interventions on identified geographical hotspots and populations at increased risk for suicide.
The South Carolina Department of Mental Health (SCDMH), in partnership with local researchers, built an online mental health data hub to enhance data-driven decision-making within SCDMH and among its partners. The hub provides easy access to annual surveillance data and quarterly real-time data reports. Data points include demographic information (i.e., race, ethnicity, gender, sexual orientation, and geographic data) and information on behavioral health disparities and social determinants of health related to mental health traumas and suicide deaths, attempts, and ideation.
Data sets and partners include the South Carolina Violent Death Reporting System; incidents of mental health trauma, suicide attempts, and suicidal ideation treated in state hospital emergency departments; emergency medical system self-harm calls (PreMIS data), Adverse Childhood Experiences (SC Children’s Trust); the Social Vulnerability Index; Community Health Rankings and Road Maps; and crisis resources access (e.g., 988, SCDMH Mobile Crisis, Interactive Screening Program). SCDMH also distributes quarterly infographics to partners.
New York houses a suicide and self-harm dashboard that brings together the New York Department of Health (DOH) fatality data and statewide hospital discharge data in one user-friendly webpage. New York now has three years of data in the dashboard so community members can access suicide death, suicide attempt, and self-harm data sorted by demographics and county. The DOH also makes data on suicide and self-harm available to county health officials through an online portal and regularly disseminates county alerts when the number of emergency department visits is higher than expected. Access to this data can help facilitate local response. Suicide Prevention Center of New York uses an array of data sources and partners to develop a comprehensive understanding of suicide morbidity, mortality, and risk and protective factors among New Yorkers. They have learned that partnerships among state offices and agencies are essential to maximizing data-informed action.
The Ohio Public Health Information Warehouse provides free access to past and present mortality data and other health-related data. To support local use of this resource, the Ohio Department of Health and the Ohio Suicide Prevention Foundation collaborated to provide free online and in-person training opportunities. These trainings support county-based suicide prevention coalitions in accessing real-time death record data specific to their county and/or region. Community partners can use the information warehouse to compare their community’s death record data to that of neighboring counties and/or the state, see trends in suicide deaths, and plan their suicide prevention efforts. The Suicide Prevention Plan for Ohio also calls for the use of other data sources to inform planning, including insurance claims data, Syndromic Surveillance Systems, and information gleaned from local suicide fatality reviews and psychological autopsies. The state continuously evaluates suicide prevention efforts to identify areas of success in implementing the plan.
The Virginia Department of Health’s Injury and Violence Prevention (IVP) Program receives quarterly hospital discharge data from all Virginia-licensed hospitals through a data-sharing agreement between the Department of Health and Virginia Health Information. IVP also receives emergency department and urgent care visit data as part of syndromic surveillance data reporting. All licensed hospitals report these data no more than 24 hours after a visit occurs. These data help the IVP Program identify geographic areas and/or demographic groups in need of additional suicide prevention resources. They may also highlight the need for suicide-related treatment services in specific hospitals, counties, or regions.
D.C. Law 21-120 implemented a District of Columbia (D.C.)-wide code that requires all public and public charter schools to implement suicide prevention and postvention policies. Policies focus on supporting youth populations identified as high-risk through the biennial D.C. Youth Risk Behavior Survey (YRBS) for students in grades 6–12. The law also implemented a pilot program in which participating grade 7–10 schools conduct “climate surveys” with students, parents, and school professionals. The surveys gather information that helps each school and the D.C. Office of the State Superintendent of Education evaluate the social and emotional environment of each school campus. Responses can be analyzed with consideration given to student demographics, such as race/ethnicity, gender, and primary language. D.C. administers and reports on the published results of the YRBS every two years.
In 2013, Nevada’s Assembly Bill 29 created the Committee to Review Suicide Fatalities. The committee comprises members with diverse, local expertise, appointed by the state’s Department of Health and Human Services (DHHS) director. The committee reviews death data and identifies trends, risk factors, and strategies to prevent suicide deaths. It has the authority to investigate suicide deaths, create special reports, share information with outside teams, and share reports with the DHHS director. In 2021, legislators passed Assembly Bill 181, requiring health care facilities to report suicide deaths, suicide attempts, and suspected suicide attempts to the Division of Public and Behavioral Health.
Colorado’s Department of Public Health and Environment (CDPHE) analyzes death data received through the state’s participation in the National Violent Death Reporting System. CDPHE shares suicide death data on a public-facing data dashboard, making it accessible to local and state partners. This allows partners to see the impact of suicide deaths in their communities to inform their local and state suicide prevention efforts. The Colorado Office of Suicide Prevention encourages coroners to complete the state’s Suicide Death Investigation Form so that Colorado can compile more comprehensive data on the sexual orientations and gender identities of people who die by suicide. There is currently a critical gap in this type of suicide death data in Colorado and nationally.
The Oregon Health Authority (OHA) gathers a range of high-quality data on suicide prevention to guide state-level efforts. These data include:
– Oregon Violent Death Reporting System data
– Syndromic surveillance data and emergency department and public and private hospital discharge data on treatment of self-harm and suicide attempts
Oregon uses these data to update public facing data dashboards, which include state- and county-level, syndromic surveillance, and 988 Suicide & Crisis Lifeline call center data. OHA works closely with the Oregon Alliance to Prevent Suicide to respond to data needs. OHA provides context for the data and reviews the limitations of data systems, especially related to race, ethnicity, and LGBTQIA2S+ data. To support partner engagement, OHA has developed a data glossary to provide an overview of data sources. OHA’s access to a variety of data sources enables it to crosswalk data and make evidence-informed decisions on suicide prevention needs and strategies.
Virginia’s Injury and Violence Prevention Program houses two full-time staff devoted to data epidemiology and evaluation. These staff members support comprehensive quantitative and qualitative evaluation of all violence prevention programs in Virginia. Though the positions are not focused exclusively on suicide prevention, a core piece of their work includes analyzing Virginia’s suicide-related data. These staff members also work closely with the state’s suicide prevention program to guide state suicide prevention planning.
The Massachusetts Department of Public Health employs a full-time epidemiologist in its Injury Surveillance Program and Office of Statistics and Evaluation. The position is funded through the commonwealth’s annual $8 million budget line item for suicide prevention. The epidemiologist oversees the analysis, interpretation, and dissemination of injury data with a focus on suicide and self-injury, and directly supports the Massachusetts Suicide Prevention Program by analyzing data, preparing reports, helping to develop surveillance procedures, and evaluating the commonwealth’s suicide prevention plan.
New Hampshire’s public-private, interdisciplinary Suicide Prevention Council (SPC) was established by law in 2006. At that time, the council’s originating members signed a memorandum of understanding outlining their respective roles and the council’s overall functions. With oversight from its Leadership Team, SPC has since expanded and currently includes six active committees: (1) Communications, (2) Survivors of Suicide Loss, (3) First Responders, (4) Military and Veterans, (5) Public Policy, and (6) Data. SPC also contributes to the development of New Hampshire’s suicide prevention plan and coordinates with key partners on the state’s Suicide Prevention Council’s Annual Report.
During its 2021 strategic planning process, the SPC established a charter—the New Hampshire State Suicide Prevention Plan, 2021-2024. The plan includes information about the SPC, the guiding principles that informed the planning process, SPC’s current goals and objectives, and a measurement framework to assess progress.
The Utah Department of Health and Human Services, Office of Substance Use and Mental Health (DHHS) collaborates with members of the Utah Suicide Prevention Coalition—comprising substance use prevention professionals, violence and injury prevention professionals, health care providers, local prevention coalitions, and private businesses—to support the integration of suicide prevention strategies into members’ respective areas of work. As part of this effort, DHHS develops and disseminates resources and best practices strategies on the highly visible LiveOnUtah.org. DHHS also delivers training and technical assistance to public and private entities to encourage the development and implementation of policies and practices for mental wellness and suicide prevention and postvention.
The Connecticut Suicide Advisory Board (CTSAB) and its statewide coalition of more than 900 members and 300 organizations are responsible for developing and implementing the state’s suicide prevention plan. The current PLAN 2025 reflects the professional and personal experiences of a broad range of public and private groups and individuals with an interest and investment in suicide prevention efforts. Their insights were collected through a survey (n=243) of the suicide prevention community, 18 focus group sessions, and more than 100 key informant interviews. This process helped build a unified plan for actualizing the CTSAB’s mission and vision.
In 2015, North Carolina published the North Carolina Suicide Prevention Plan, a state plan that outlined a shared vision for the state’s suicide prevention efforts across the lifespan. It was developed by a planning group of nine members who invited an additional 150 North Carolina partners to collaborate. This plan was primarily focused on establishing a larger vision for suicide prevention in the state. Several years later, the partners realized that the state needed a more detailed action plan to supplement its visionary plan. The resulting 2021-2025 Suicide Prevention Action Plan includes specific strategies to reach marginalized and higher-risk populations, including veterans and members of rural and BIPOC communities. For example, the plan created a suicide prevention education program that engaged faith leaders in rural areas that had few mental health providers. This education program appealed to Black churches, so they hired a Black pastor to facilitate the discussion groups.
The Suicide Prevention Center of New York (SPCNY) realized its impact was limited by a lack of statewide partners, which led to the creation of the New York State (NYS) Suicide Prevention Council. Using the framework of the NYS Suicide Prevention Plan, the council advises SPCNY and amplifies its work. The council’s vision is for SPCNY to be grounded in science and wisdom gained from diverse community experiences to work toward a suicide-free New York. The council members’ resources, expertise, and insights from suicide-centered lived experience facilitate systemic changes that support and advance suicide prevention. NYS suicide prevention coalitions also serve as vital parts of the state’s suicide prevention infrastructure. Coalitions maintain communication and share strategies through a coalition academy. The coalitions benefit from online webinars and learning modules, which create a shared understanding of suicide prevention and safe messaging best practices that can be implemented at the local level.
South Carolina’s Suicide Prevention Coalition brings together suicide prevention leaders from state agencies, mental health nonprofit organizations, and justice systems. It is chaired by a South Carolina senator and the acting director of the South Carolina Department of Mental Health. Its mission is to develop broad-based support for suicide prevention by reducing the stigmatization of suicide, advocating for change in policies and practices, and raising awareness about suicide. Last year, the coalition formed three subcommittees that played a key role in implementing the state’s suicide prevention plan; advocated for suicide prevention, mental health crisis funding, and legislative bills; shared data, resources, and trainings; and led a suicide prevention awareness campaign.
Prevent Suicide Wisconsin (PSW) is the designated statewide coalition for suicide prevention, convened by Mental Health America of Wisconsin through a grant from the Wisconsin Department of Health Services. It is tasked with overseeing the promotion and implementation of the state suicide prevention plan. The PSW Steering Committee is made up of individuals representing local suicide prevention coalitions, universities and colleges, peer-run respites, organizations representing groups with disproportionate risk of suicide (e.g., Tribal communities, veterans’ organizations), and other mental health and suicide prevention advocacy groups.In a state with a small and dispersed population, collaboration is key to ensuring that resources are well managed. Wyoming’s state suicide prevention program is small but collaborates regularly with other governmental and non-governmental organizations to make sure prevention efforts reach the people who need them most. For example, to reach Wyoming’s geographically isolated agricultural communities, the state partners with other state agencies, such as the Department of Agriculture, as well as county and community partners, such as local 4-H organizations, parks services, fairs and rodeos, and other programs, to better reach populations that are often underserved by health and mental health services.
The Colorado Suicide Prevention Commission provides public, private, and nonprofit leadership and recommendations for suicide prevention efforts and serves in an advisory capacity to the Colorado Office of Suicide Prevention. It is made up of 26 commissioners who represent Coloradans with suicide-centered lived experience, Coloradans who work in suicide prevention organizations and programs, and Coloradans who come from communities and sectors disproportionately affected by suicide. The Commission convenes multiple groups that work to prevent suicide among different populations, including older adults, veterans, and young people ages 0-24. They prioritize equity and addressing disparities that impact Coloradans.
In October 2023, the South Carolina Department of Mental Health (SCDMH)’s Division of Inpatient Services, the South Carolina Department of Corrections, and SCDMH’s Lexington County Community Mental Health Center were awarded a SAMHSA Zero Suicide grant. The three entities will use the funding to implement the Zero Suicide framework in the state’s mental health and corrections systems and strengthen care transitions between these systems.
The Connecticut Suicide Advisory Board (CTSAB) per legislation (CGS Chapter 319, 17a-52) is the single state-level advisory board that addresses suicide prevention, intervention, and response across the lifespan. The CTSAB administers the state’s suicide prevention plan, the statewide suicide prevention coalition, and regional suicide prevention coalitions. It is tri-chaired by the Connecticut Department of Children and Families (DCF), the Connecticut Department of Mental Health and Addiction Services (DMHAS), and a private foundation representing people with suicide-centered lived experience. The Connecticut Department of Public Health is also a member of the CTSAB. DPH works with DMHAS and DCF to ensure federal suicide prevention grants are aligned with the state plan’s goals and objectives. The three state agencies collaborate closely when applying for grants from federal agencies (e.g., SAMHSA, CDC). This approach helps leverage various services and systems managed by these agencies to implement, integrate, and sustain suicide prevention strategies.
The South Carolina Department of Mental Health (SCDMH) launched the youth-focused #BeeStrong campaign in the spring of 2018 to combat a recurring spring pattern of higher suicide rates. SCDMH staff took a number of steps to ensure an effective campaign:
– Researched risk factors for spring suicide deaths
– Gathered input on ways to address risk factors from their target audience via a youth advisory board
– Followed the National Action Alliance for Suicide Prevention’s Framework for Successful Messaging
– Incorporated language from well-respected suicide prevention agencies
– Engaged youth social media followers in creating and sharing campaign content
Learn more about South Carolina’s suicide prevention efforts.
Several of Maine’s government offices and departments play a role in suicide prevention, including the Maine Center for Disease Control and Prevention (primary prevention efforts), the Office of Behavioral Health (crisis services), the Department of Labor (workplace efforts), and the Department of Education (school support). To coordinate programming, Maine created an inter-governmental Suicide Prevention Steering Committee. The committee played a key role in ensuring smooth implementation of the state’s centralized 988 crisis services line. It also facilitated statewide conversations about the role of certified community behavioral health centers in suicide prevention and led a collaborative project to increase access to behavioral telehealth in this largely rural state.
The Tennessee Suicide Prevention Network maintains a governor-appointed advisory council comprising nonpartisan public and private agencies and individuals. One of the responsibilities of the council is to connect with Tennessee’s Intra-State Departmental Group, which includes appointed representatives from a variety of state agencies (e.g., Department of Health, Commission on Aging and Disability). The network helps to ensure that state and local agency priorities are heard and recognized, supports regional county task forces, and promotes ownership of suicide prevention across government sectors and geographic regions.
In 2021, New Hampshire established a Statewide Suicide Prevention Coordinator position in the state’s Department of Health and Human Services (DHHS). This position is responsible for coordinating statewide suicide prevention activities, monitoring implementation of the state’s suicide prevention plan, and supporting the New Hampshire Suicide Prevention Council. The New Hampshire Suicide Prevention Council was created to fulfill a state legislative mandate that requires the creation of an entity to focus exclusively on advancing the state’s suicide prevention efforts. It convenes four to six public sessions per year to share resources, raise awareness, and disseminate best practices in suicide prevention. The New Hampshire DHHS also supports the dissemination of best practices in suicide prevention, intervention, and postvention to communities, and responds to requests through its Public Information Office.
In a state with a small and dispersed population, collaboration is key to ensuring that resources are well managed. Wyoming’s state suicide prevention program is small but collaborates regularly with other governmental and non-governmental organizations to make sure prevention efforts reach the people who need them most. For example, to reach Wyoming’s geographically isolated agricultural communities, the state partners with other state agencies, such as the Department of Agriculture, as well as county and community partners, such as local 4-H organizations, parks services, fairs and rodeos, and other programs, to better reach populations that are often underserved by health and mental health services.
When staff at the Missouri Department of Mental Health (MDMH) receive questions about suicide or when news related to suicide is released, the MDMH director of public and legislative affairs works to organize a timely response. The director contacts the state’s suicide prevention coordinator, who reaches out to one or more experts (e.g., medical directors of local behavioral health centers, health professionals, researchers) in their network to create a formal response. The director also shares the Best Practices and Recommendations for Reporting on Suicide, the 988 logo, and end cards for media with anyone who reaches out to the MDMH for information.
Many states host suicide prevention trainings that bring together subject matter experts, state-level professionals, and health/behavioral health and community partners to strengthen suicide prevention, intervention, and postvention capacity. In Maryland, the Office of Suicide Prevention develops and sustains a wide variety of integrated and multi-faceted trainings, conferences, and other programs that address demonstrated and unmet needs across jurisdictions and populations. Learn more about Maryland’s suicide prevention efforts here.
Many states send their suicide prevention coordinators and other key program staff to the American Association of Suicidology Annual Conference to learn about the latest research and network with national and international suicide prevention professionals. Many states also rely on support from grant funding for other types of staff professional development. In addition, state suicide prevention leads can engage in suicide prevention networking and training opportunities through SPRC and other national organizations. SPRC’s online offerings for state suicide prevention leads (such as online trainings, resources, webinars, communities of learning, and listservs) allow leaders from states with limited travel funding to engage in education with national experts and network with peers from across the United States.
The Ohio Suicide Prevention Foundation (OSPF) is a statewide non-profit organization that educates, advocates, and builds connections and support for individuals, families, and communities to prevent suicide. OSPF employs 11 full-time staff members dedicated to all levels of suicide prevention, including program staff focused on youth, veterans, and coalitions; communications staff; and development staff. OSPF uses funding streams from federal, state, and foundation grants, as well as other private funding, to support the entire continuum of suicide prevention, from upstream prevention to postvention. The OSPF Communications Team ensures that resources are promoted widely in local communities. Additionally, OSPF is responsible for coordinating, tracking, and reporting on the progress of The Suicide Prevention Plan for Ohio, which has an Implementation Team that includes multiple sectors and more than 40 partners.
The Nevada Office of Suicide Prevention (NOSP) was established by the Nevada legislature in 2005 to develop and implement a comprehensive, statewide suicide prevention strategy focused on building suicide prevention capacity within communities, promoting evidence-based practices, and establishing comprehensive data collection practices. Over time, limited and sometimes unreliable funding sources made it difficult to create suicide prevention efforts that were sustainable, appropriately scaled, and capable of affecting suicide rates. To address this challenge and enhance stability, the NOSP moved to the Bureau of Behavioral Health, Wellness and Prevention, which provides NOSP with critical administrative support. The move expanded NOSP’s capacity to engage in strategic collaborations that broaden its reach across the state.
In 2013, Utah passed House Bill 154, which required the creation of full-time suicide prevention coordinator positions at both the Utah Department of Human Services’ Division of Substance Abuse and Mental Health and the Utah State Board of Education. The bill provided an annual appropriation to support these positions. Both coordinator positions oversee continuing efforts to implement suicide prevention efforts across the state, including the Utah Suicide Prevention Coalition, many local coalitions, and local education agencies. Consistent leadership in these two state agencies supports programming that impacts local communities and schools. These agencies also work collaboratively across the public and private sectors to enhance the quality of their efforts.
In 2017, Indiana passed House Enrollment Act (HEA) 1430, which mandated the creation of a statewide suicide prevention program in the Indiana Division of Mental Health and Addiction (DMHA). DMHA employed a state suicide prevention coordinator tasked with developing a state suicide prevention plan that included educational opportunities, suicide risk identification training, coordination of county and regional advisory groups, and recommendations for improved data collection. The coordinator position is funded through SAMHSA’s Mental Health and Substance Use Block Grant.
The effort to pass HEA 1430 was led by the Indiana Suicide Prevention Network. This network includes members from the public and private sectors who collaborate on efforts to improve knowledge, practice, public understanding, and public policy on suicide prevention in Indiana.
Today, the DMHA coordinator oversees a suicide prevention team that includes positions focused on suicide prevention among youth, veterans, and Black populations and community engagement coordination.
In 2018, Virginia passed House Bill No. 569, which appointed the Virginia Department of Behavioral Health and Development Services (DBHDS) as the state’s lead agency for suicide prevention. The bill also mandated that DBHDS collaborate with community service boards, behavioral health authorities, the Virginia Department of Health, local departments of health, and the Department for Aging and Rehabilitative Services on suicide prevention activities. The bill required the DBHDS commissioner to provide annual reports to the governor and state’s general assembly.
Minnesota Statute 145.56 requires that chairs of the state’s policy and finance committees receive biennial reports on the implementation and impact of Minnesota’s Suicide Prevention State Plan.
In 2023, Vermont passed Act 56, which authorized the Vermont Department of Mental Health’s director of suicide prevention to lead the state’s initiatives for suicide prevention, intervention, and postvention, including partnering with communities and providers to reduce suicide deaths and attempts. The act also mandated the creation and implementation of the state’s first suicide prevention strategic plan and made budget recommendations to support priorities outlined in the plan.
In 2014, Washington’s House Bill 2315 authorized the development of a suicide prevention plan with requirements to involve a steering committee, base the plan on current research, make the plan accessible to the public, and update the plan as needed.
Building on the state’s 2015 Strategic Suicide Prevention Plan, which incorporated input from over 150 partners, North Carolina created the 2021-2025 Suicide Prevention Action Plan in collaboration with key agencies and organizations responsible for conducting suicide prevention activities in the state. Each strategy in the action plan designates a lead agency or agencies. Outcomes from the plan are evaluated on an ongoing basis. healthcare, suicide prevention in higher education settings, data and evaluation, and state plan revision. This structure has helped extend the reach of PSW and supported best practices in suicide prevention across sectors.
Massachusetts has an $8 million annual budget line item that funds suicide prevention activities. For more information on how the commonwealth secured this support for suicide prevention, see their infrastructure success story: Massachusetts Authorization for Suicide Prevention Funding.
The New York State (NYS) budget for the NYS Office of Mental Health’s (OMH) Suicide Prevention Center of New York (SPCNY) provides annual funding to support suicide prevention activities across all six essential functions. This includes funding for dedicated leadership and staffing—SPCNY’s 15 employees are their greatest asset—to support suicide prevention activities using a comprehensive public health approach. In 2023, SPCNY became part of the OMH’s newly created Office of Prevention and Health Initiatives, allowing for increased focus on upstream prevention, social determinants of health, and the development of a robust cultural and structural humility lens, which encourages individual self-reflection, partnership development, and assessment and correction of existing structural power imbalances.
Oklahoma’s Suicide Prevention Act designated the Oklahoma Department of Mental Health and Substance Abuse Services (ODMHSAS) as the lead agency for the state’s suicide prevention education and activities. Originally passed to address youth suicide prevention, the law has since been amended to include statewide suicide prevention activities across the lifespan. ODMHSAS provides a variety of training opportunities and includes programs specifically intended for college and university students, veterans, and other populations disproportionately affected by suicide.
Wisconsin appointed a public-private partnership, Prevent Suicide Wisconsin (PSW), to lead suicide prevention in the state. PSW was created during a strategic planning retreat convened by Mental Health America of Wisconsin. The public-private structure of PSW, which is led by a nonprofit organization, allows for flexible organizing strategies. For example, PSW has established different subcommittees and work groups to focus on specific strategies or settings. Examples include groups focused on conference planning, best practices in healthcare, suicide prevention in higher education settings, data and evaluation, and state plan revision. This structure has helped extend the reach of PSW and supported best practices in suicide prevention across sectors.
The California Department of Public Health’s (CDPH) Office of Suicide Prevention (OSP) was created after the passage of Assembly Bill 2112 in 2021. Through the creation of OSP, CDPH was formally designated as the state entity responsible for coordinating and aligning statewide suicide prevention efforts and resources. OSP’s mission is to address the root causes of suicide and self-harm injuries by supporting strong partnerships, disseminating data, and promoting evidence-informed public health prevention strategies that create safe and healthy communities across California. OSP provides information and technical assistance on suicide prevention best practices, leads two major youth suicide prevention initiatives, and supports prevention strategies for groups disproportionally affected by suicide, including youth, veterans, Native communities, and LGTBQIA2S+ individuals. OSP also monitors, tracks, and disseminates relevant statewide and local data to inform prevention efforts at the state and local levels. For additional information, visit the CDPH OSP webpage.
The Florida Legislature originally created the Statewide Office for Suicide Prevention within the Office of the Governor as the state’s official lead agency for suicide prevention. As the state’s suicide prevention infrastructure grew, the Statewide Office for Suicide Prevention was moved to the Florida Department of Children and Families. Collaboration and a unified vision across the Statewide Office for Suicide Prevention and other agencies and organizations strengthen and support Florida’s efforts to provide a comprehensive suicide prevention approach. The state’s suicide prevention efforts are primarily advanced through the Suicide Prevention Coordinating Council, which is chaired and hosted by the Statewide Office for Suicide Prevention. For more information, please visit the department’s suicide prevention website.