
Suicide and Opioids
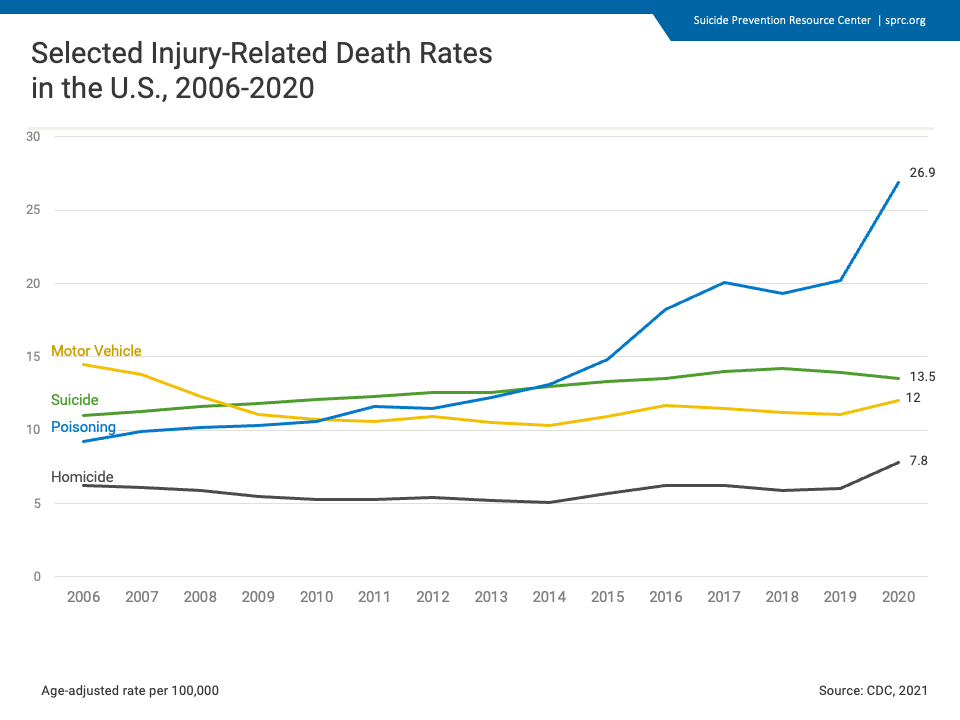
This graph represents age-adjusted death rates over a 15-year period. Motor vehicle death rates decreased from 2006 to 2014, then rose steadily until 2020. Suicide death rates saw a steady increase from 2006 to 2020. Unintentional poisonings sharply increased from 2006 to 2020. Homicides remained steady at a lower rate than the other three causes of death, with an uptick from 2019 to 2020.1
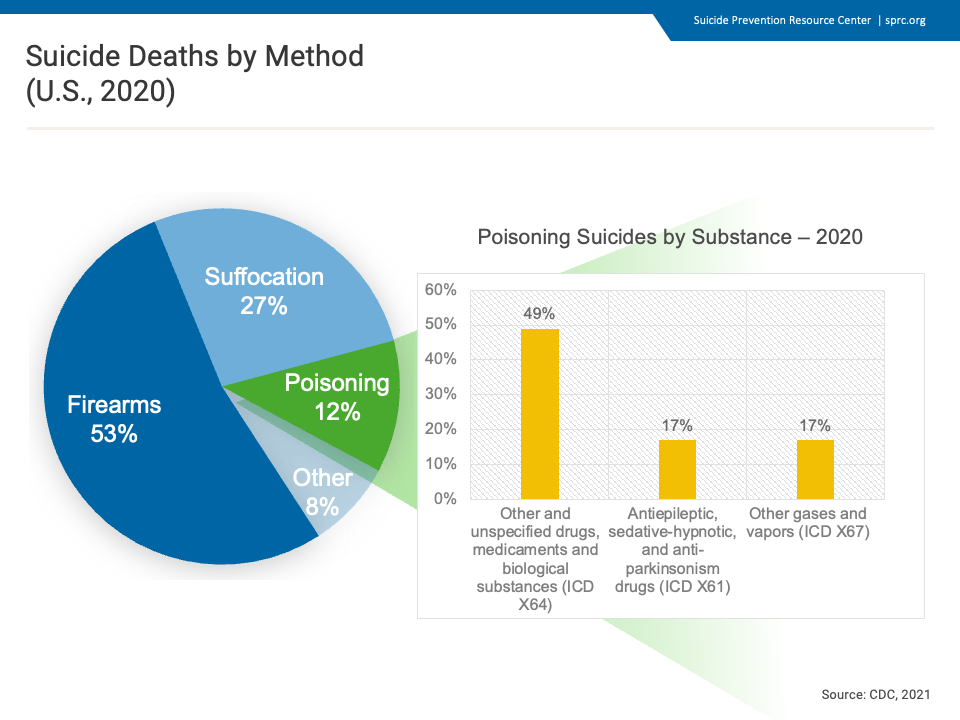
This pie chart illustrates suicide deaths by various means. In 2020 firearms accounted for a majority (53%) of the deaths by suicide, followed by suffocation (27%), and other (8%). Poisonings accounted for 12% of suicide deaths. The accompanying bar graph illustrates the various substances used in suicide deaths by poisoning. As the graph shows, other and unspecified drugs, medicaments, and biological substances were contributors in over 49% of poisoning deaths.1
References
- Centers for Disease Control and Prevention. (2021). 1999-2020 Wide ranging online data for epidemiological research (WONDER), multiple cause of death files [Data file]. National Center for Health Statistics. http://wonder.cdc.gov/ucd-icd10.html
 | The charts and graphs in this section are also available as a PowerPoint slide set. Feel free to use this slide set to deliver a presentation about the scope of the suicide problem. |